Dobbs Ferry: Fire Incidents, New York (NY)
Where are fire incidents reported in Dobbs Ferry, NY
Something went wrong! Please refresh the page.
|
| |||||||||||||||||||||||||||||||||||||||||||||||||||||||||||||||||||||||||||||||||||||||||||||||||||||||||||||
2002 - 2018 National Fire Incident Reporting System (NFIRS) incidents
- Incident types reported to NFIRS in Dobbs Ferry, NY
- 77132.4%Hazardous Condition
- 68929.0%False Alarm
- 51821.8%Fire
- 1697.1%Service Call
- 1375.8%Rescue & EMS
- 532.2%Good Intent Call
- 180.8%Severe Weather
- 170.7%Overpressure Rupture
- 60.3%Special Incident
- Fire incident types reported to NFIRS in Dobbs Ferry, NY
- 44485.7%Structure Fires
- 377.1%Outside Fires
- 295.6%Mobile Property/Vehicle Fires
- 81.5%Other
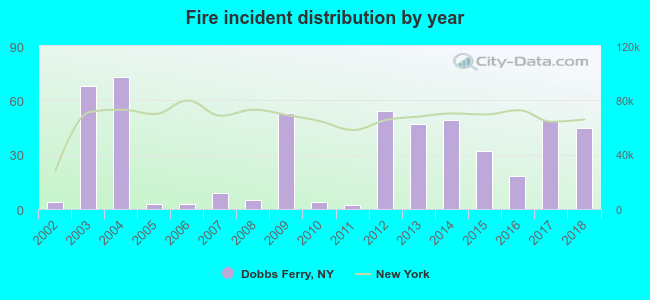 According to the data from the years 2002 - 2018 the average number of fire incidents per year is 30. The highest number of fire incidents - 73 took place in 2004, and the least - 2 in 2011. The data has a rising trend.
The average number of yearly fire incidents per 10k residents in Dobbs Ferry, NY compared to nearest cities:
(Note: Based on data for the last 3 years, including only cities with population 5,000 and above)
| Dobbs Ferry: | 33.6 |
| Irvington: | 18.2 |
| Greenburgh: | 6.7 |
| Hartsdale: | 102.7 |
| Tarrytown: | 8.4 |
| Scarsdale: | 26.9 |
| Tappan: | 32.3 |
| Tuckahoe: | 45.8 |
| Eastchester: | 27.6 |
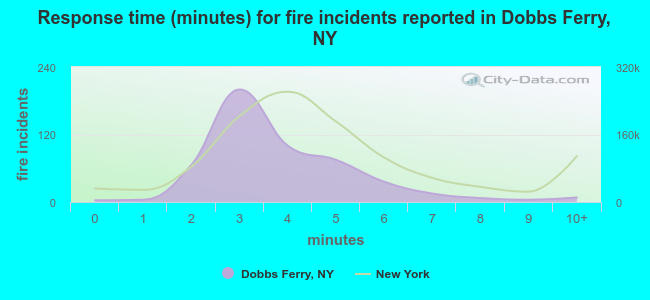 The median response time based on all reported fire incidents is 3 minutes. This is lower compared to the state median value.
The median response time in Dobbs Ferry, NY compared to nearest cities:
(Note: Based on data for all years, including only cities with at least 500 fire incidents)
| Dobbs Ferry: | 3 minutes |
| Greenburgh: | 6 minutes |
| Hartsdale: | 4 minutes |
| Elmsford: | 5 minutes |
| Scarsdale: | 4 minutes |
| Eastchester: | 5 minutes |
| Yonkers: | 5 minutes |
| Orangeburg: | 3 minutes |
| White Plains: | 4 minutes |
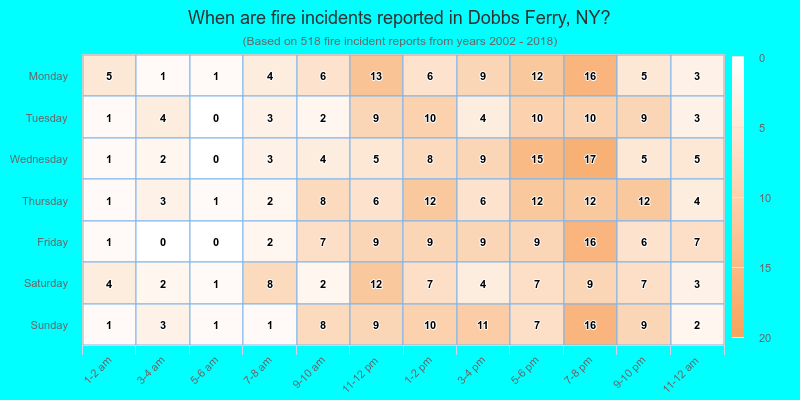
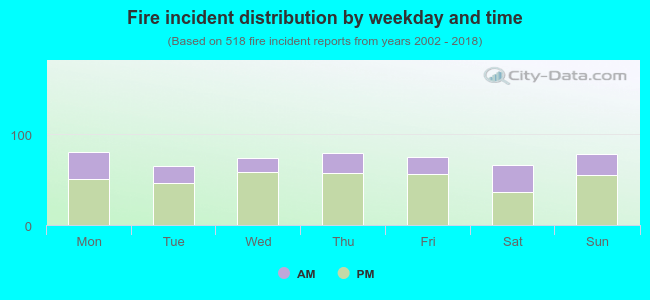 30.1% incidents where reported in the morning and 69.9% in the evening. The most fires (15.6%) took place on Monday, and the least (12.5%) on Tuesday.
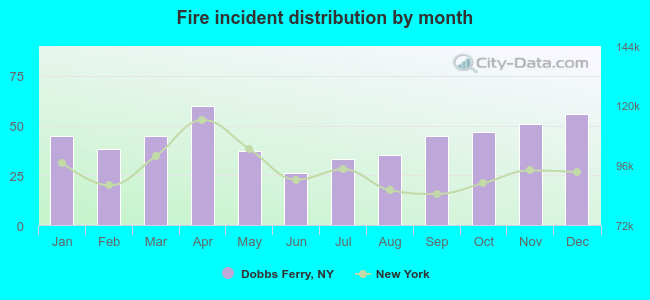 According to the 518 fire incident reports from years 2002 - 2018 most fires (11.6%) took place during April, and the least (5.0%) in June.
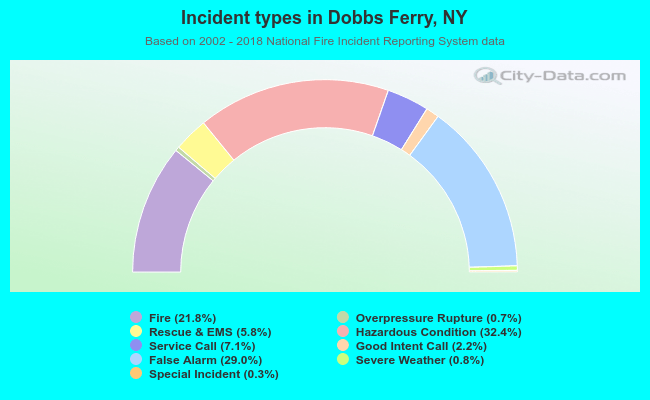 Out of all 2,378 cases reported during the years 2002 - 2018, the most belonged to the categories: Hazardous Condition (32.4%), False Alarm (29.0%), and Fire (21.8%).
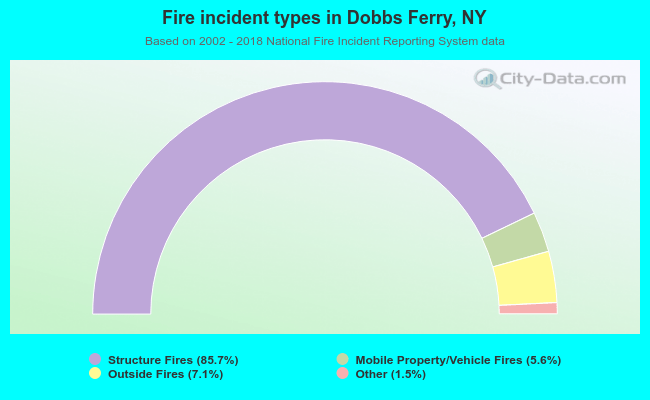 When looking into fire subcategories, the most reports belonged to: Structure Fires (85.7%), and Outside Fires (7.1%).