Riverview: Fire Incidents, Michigan (MI)
Where are fire incidents reported in Riverview, MI
Something went wrong! Please refresh the page.
|
| |||||||||||||||||||||||||||||||||||||||||||||||||||||||||||||||||||||||||||||||||||||||||||||||||||||||||||||
2002 - 2018 National Fire Incident Reporting System (NFIRS) incidents
- Incident types reported to NFIRS in Riverview, MI
- 76238.5%Rescue & EMS
- 40820.6%Fire
- 34817.6%Hazardous Condition
- 28614.5%False Alarm
- 894.5%Service Call
- 643.2%Good Intent Call
- 110.6%Overpressure Rupture
- 80.4%Special Incident
- 20.1%Severe Weather
- Fire incident types reported to NFIRS in Riverview, MI
- 24058.8%Structure Fires
- 9222.5%Outside Fires
- 4611.3%Other
- 307.4%Mobile Property/Vehicle Fires
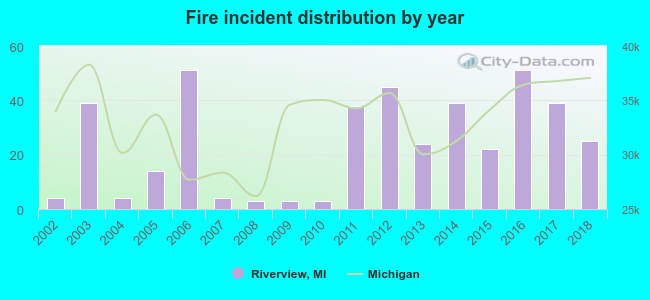 Based on the data from the years 2002 - 2018 the average number of fires per year is 24. The highest number of reported fire incidents - 51 took place in 2006, and the least - 3 in 2008. The data has a growing trend.
The average number of yearly fire incidents per 10k residents in Riverview, MI compared to nearest cities:
(Note: Based on data for the last 3 years, including only cities with population 5,000 and above)
| Riverview: | 31.4 |
| Southgate: | 18.0 |
| Trenton: | 15.6 |
| Wyandotte: | 23.3 |
| Grosse Ile: | 12.7 |
| Woodhaven: | 25.9 |
| Lincoln Park: | 28.0 |
| Taylor: | 28.1 |
| Ecorse: | 49.0 |
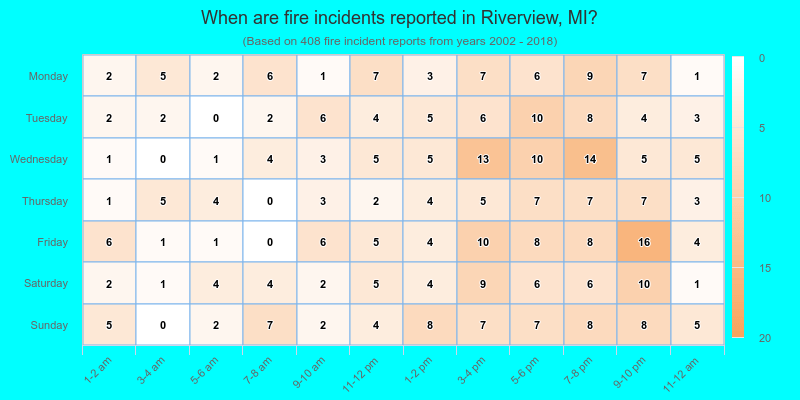
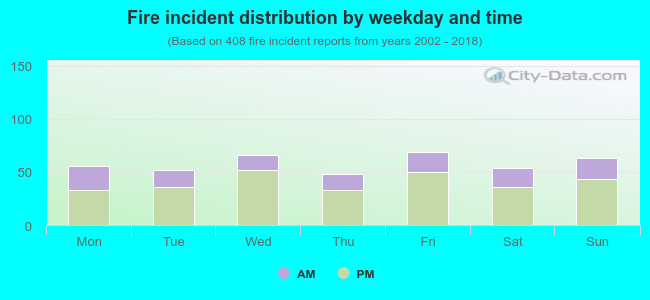 30.6% incidents where reported in the morning and 69.4% in the evening. The most fires (16.9%) took place on Friday, and the least (11.8%) on Thursday.
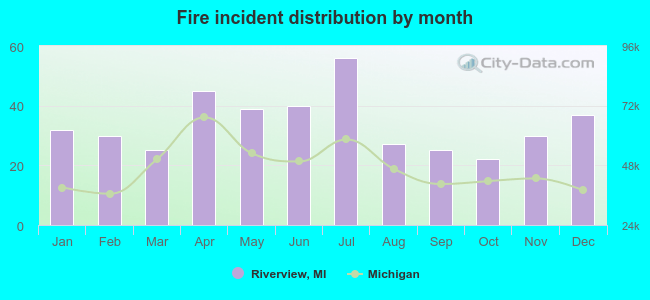 According to the 408 incident reports from years 2002 - 2018 most fires (13.7%) took place during July, and the least (5.4%) in October.
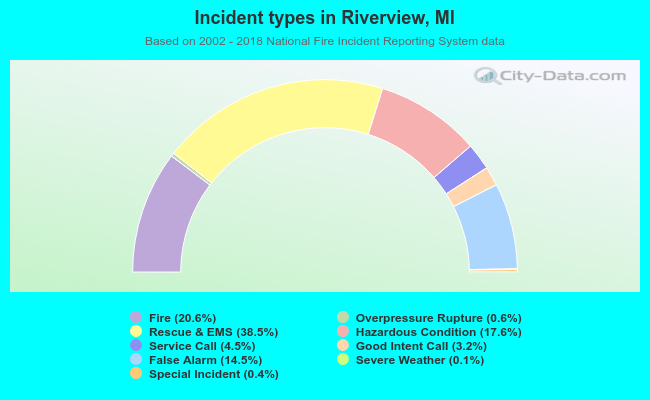 Out of all 1,978 cases reported during the years 2002 - 2018, the most belonged to the categories: Rescue & EMS (38.5%), Fire (20.6%), and Hazardous Condition (17.6%).
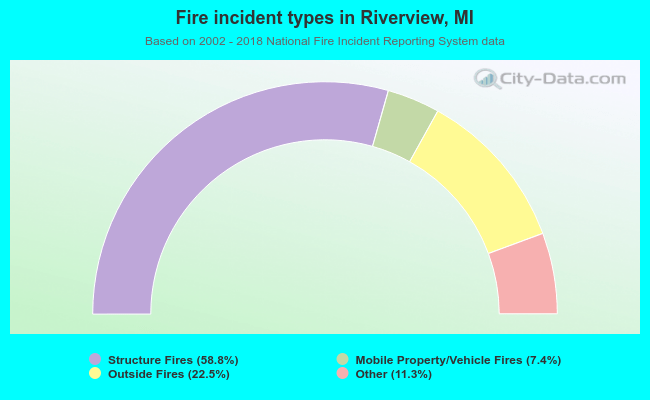 When looking into fire subcategories, the most incidents belonged to: Structure Fires (58.8%), and Outside Fires (22.5%).