Fairland: Fire Incidents, Indiana (IN)
Where are fire incidents reported in Fairland, IN
Something went wrong! Please refresh the page.
|
| |||||||||||||||||||||||||||||||||||||||||||||||||||||||||||||||||||||||||||||||||||||||||||||||||||||||||||||
2002 - 2017 National Fire Incident Reporting System (NFIRS) incidents
- Incident types reported to NFIRS in Fairland, IN
- 96249.0%Rescue & EMS
- 61631.4%Fire
- 1829.3%Good Intent Call
- 824.2%Hazardous Condition
- 723.7%Service Call
- 422.1%False Alarm
- 70.4%Special Incident
- Fire incident types reported to NFIRS in Fairland, IN
- 32152.1%Outside Fires
- 17027.6%Structure Fires
- 8513.8%Mobile Property/Vehicle Fires
- 406.5%Other
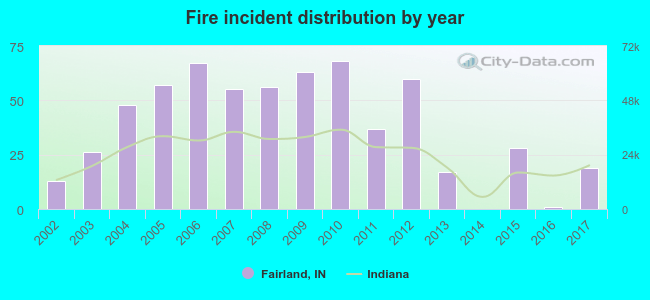 Based on the data from the years 2002 - 2017 the average number of fires per year is 38. The highest number of fires - 68 took place in 2010, and the least - 0 in 2014. The data has a rising trend.
 The median response time based on all reported fire incidents is 8 minutes. This is higher than the Indiana median value.
The median response time in Fairland, IN compared to nearest cities:
(Note: Based on data for all years, including only cities with at least 500 fire incidents)
| Fairland: | 8 minutes |
| Shelbyville: | 5 minutes |
| New Palestine: | 6 minutes |
| Franklin: | 4 minutes |
| Greenwood: | 6 minutes |
| Greenfield: | 6 minutes |
| Beech Grove: | 4 minutes |
| Bargersville: | 7 minutes |
| Edinburgh: | 7 minutes |
 23.7% incidents where reported in the morning and 76.3% in the evening. The most fires (16.2%) took place on Monday, and the least (11.5%) on Thursday.
 According to the 616 fire incidents from years 2002 - 2017 most fires (12.2%) took place during May, and the least (5.4%) in January.
 Out of all 1,964 cases reported during the years 2002 - 2017, the most belonged to the categories: Rescue & EMS (49.0%), Fire (31.4%), and Good Intent Call (9.3%).
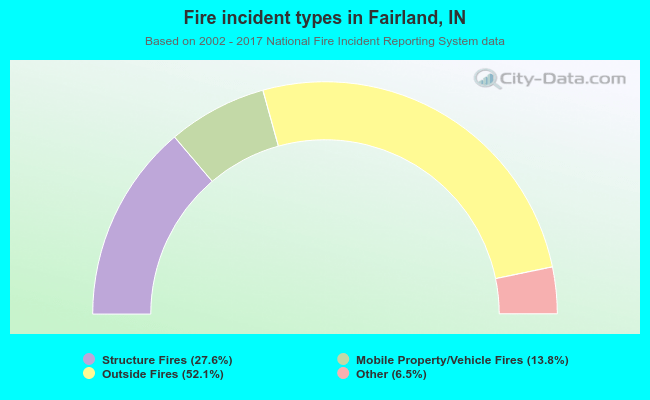 When looking into fire subcategories, the most incidents belonged to: Outside Fires (52.1%), and Structure Fires (27.6%).