Greenwood: Fire Incidents, Indiana (IN)
Where are fire incidents reported in Greenwood, IN
Something went wrong! Please refresh the page.
| Fire incidents reported | |
|---|---|
| Sreet name | Count |
| SMITH VALLEY RD | 196 |
| US 31 | 150 |
| STATE ROAD 135 | 126 |
| MORGANTOWN RD | 110 |
| MAIN ST | 84 |
| COUNTY LINE RD | 74 |
| STONES CROSSING RD | 68 |
| U.S. 31 | 52 |
| EMERSON AVE | 50 |
| OLIVE BRANCH RD | 50 |
| PETERMAN RD | 50 |
| MERIDIAN ST | 44 |
| OLD SMITH VALLEY RD | 42 |
| SR 135 | 42 |
| FRY RD | 36 |
| FAIRVIEW RD | 34 |
| I65 | 34 |
| MADISON AVE | 34 |
| MARLIN DR | 32 |
| MULLINIX RD | 32 |
| BERRY RD | 30 |
| STATE ROAD 37 | 30 |
| BLUFF RD | 26 |
| BROADWAY ST | 26 |
| PARK DR | 26 |
| SHADY BROOK HEIGHTS | 26 |
| SMOKEY ROW RD | 26 |
| STELLA DR | 24 |
| CURRY RD | 20 |
| HONEY CREEK RD | 20 |
| Other | 1,271 |
2002 - 2018 National Fire Incident Reporting System (NFIRS) incidents
- Incident types reported to NFIRS in Greenwood, IN
- 7,35545.8%Rescue & EMS
- 2,86517.8%Fire
- 2,52715.7%Hazardous Condition
- 1,1637.2%Good Intent Call
- 1,0506.5%False Alarm
- 9555.9%Service Call
- 650.4%Special Incident
- 520.3%Overpressure Rupture
- 360.2%Severe Weather
- Fire incident types reported to NFIRS in Greenwood, IN
- 1,28945.0%Outside Fires
- 98934.5%Structure Fires
- 37313.0%Mobile Property/Vehicle Fires
- 2147.5%Other
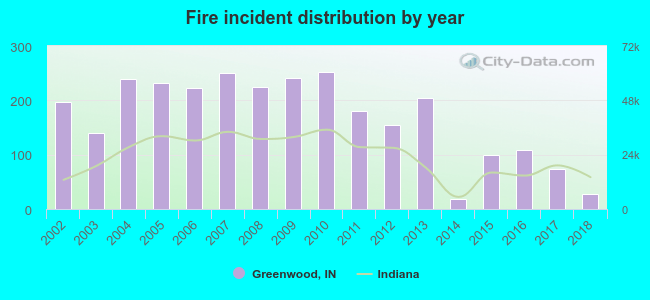 According to the data from the years 2002 - 2018 the average number of fires per year is 169. The highest number of reported fires - 252 took place in 2010, and the least - 19 in 2014. The data has a decreasing trend.
The average number of yearly fire incidents per 10k residents in Greenwood, IN compared to nearest cities:
(Note: Based on data for the last 3 years, including only cities with population 5,000 and above)
| Greenwood: | 12.8 |
| New Whiteland: | 22.9 |
| Bargersville: | 39.2 |
| Beech Grove: | 10.3 |
| Franklin: | 20.0 |
| Indianapolis: | 5.2 |
| Mooresville: | 102.3 |
| Speedway: | 40.2 |
| Plainfield: | 9.8 |
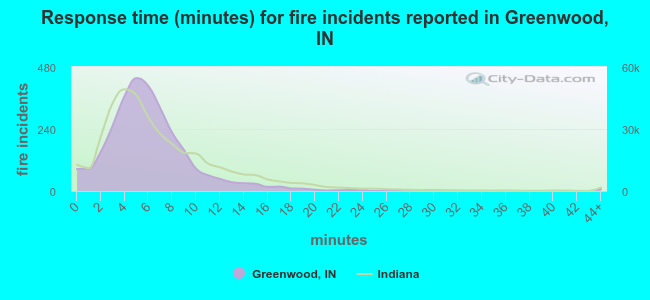 The median response time based on all reported fire incidents is 6 minutes. This is comparable to the state median value.
The median response time in Greenwood, IN compared to nearest cities:
(Note: Based on data for all years, including only cities with at least 500 fire incidents)
| Greenwood: | 6 minutes |
| Bargersville: | 7 minutes |
| Beech Grove: | 4 minutes |
| Franklin: | 4 minutes |
| Indianapolis: | 6 minutes |
| Mooresville: | 6 minutes |
| Fairland: | 8 minutes |
| New Palestine: | 6 minutes |
| Plainfield: | 6 minutes |
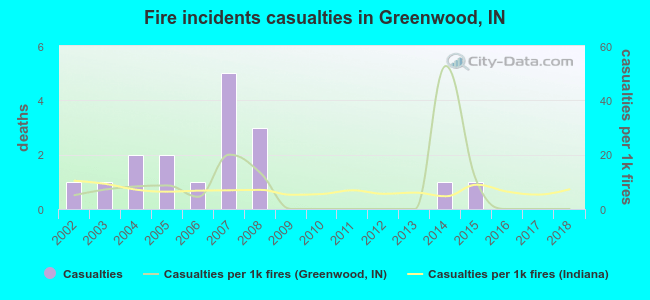 According to the reports from the years 2002 - 2018 the average number of fire-related yearly casualties is 1. The highest number of reported casualties - 5 took place in 2007, and the lowest - 0 in 2009. The data has a decreasing trend.
The average number of injuries per 1,000 fire incidents is 8. This indicator was the highest - 53 in 2014, and the lowest 0 in 2009. The trend for injuries per 1,000 incidents is declining. Compared to the Indiana value the number of casualties per 1,000 fires is similar.
According to the reports from the years 2002 - 2018 the average number of fire-related yearly casualties is 1. The highest number of reported casualties - 5 took place in 2007, and the lowest - 0 in 2009. The data has a decreasing trend.
The average number of injuries per 1,000 fire incidents is 8. This indicator was the highest - 53 in 2014, and the lowest 0 in 2009. The trend for injuries per 1,000 incidents is declining. Compared to the Indiana value the number of casualties per 1,000 fires is similar.Casualties per 1,000 incidents in Greenwood, IN compared to nearest cities:
(Note: Based on data for all years, including only cities with at least 500 fire incidents)
| Greenwood: | 5.9 |
| Bargersville: | 7.1 |
| Beech Grove: | 21.4 |
| Franklin: | 0.8 |
| Indianapolis: | 4.7 |
| Mooresville: | 11.7 |
| Fairland: | 1.6 |
| New Palestine: | 6.5 |
| Plainfield: | 33.4 |
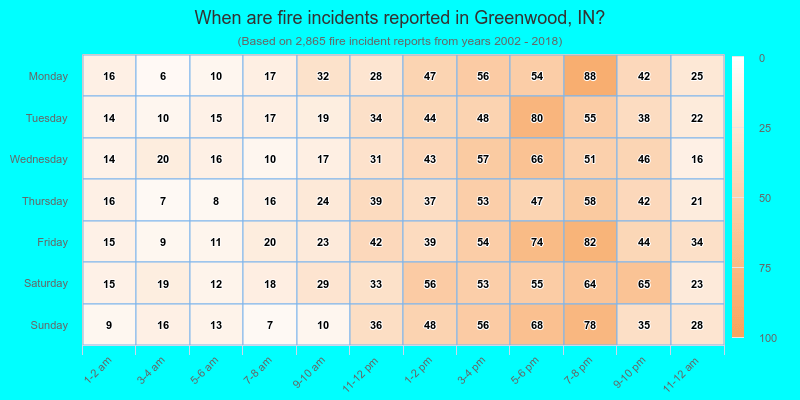
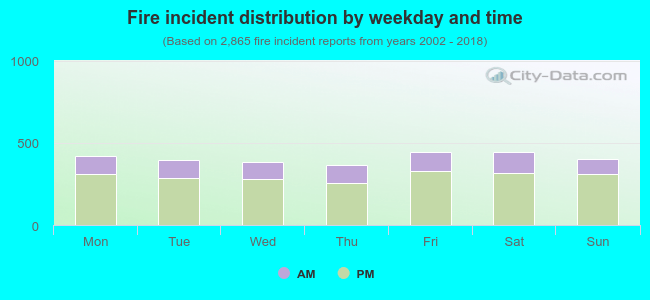 27.0% incidents where reported in the morning and 73.0% in the evening. The most fires (15.6%) took place on Friday, and the least (12.8%) on Thursday.
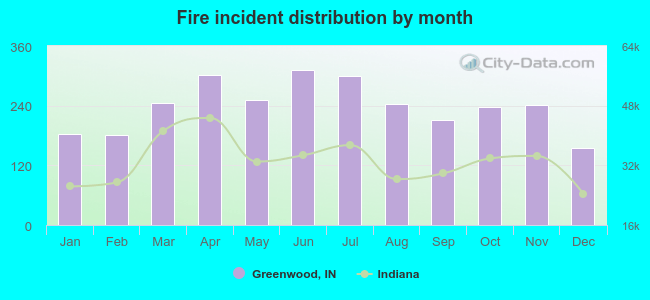 Based on the 2,865 fire incident reports from years 2002 - 2018 most fires (10.9%) took place during June, and the least (5.4%) in December.
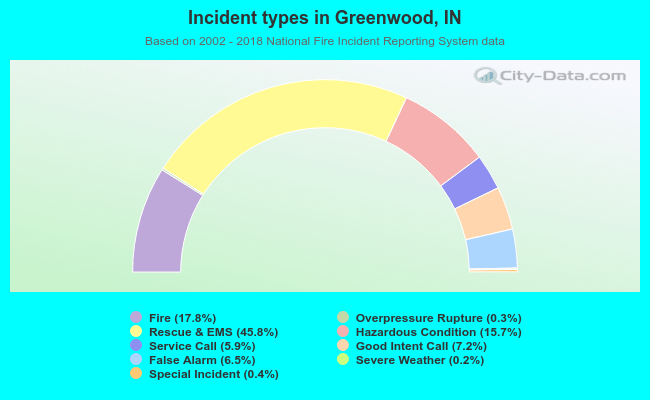 Out of all 16,068 cases reported during the years 2002 - 2018, the most belonged to the categories: Rescue & EMS (45.8%), Fire (17.8%), and Hazardous Condition (15.7%).
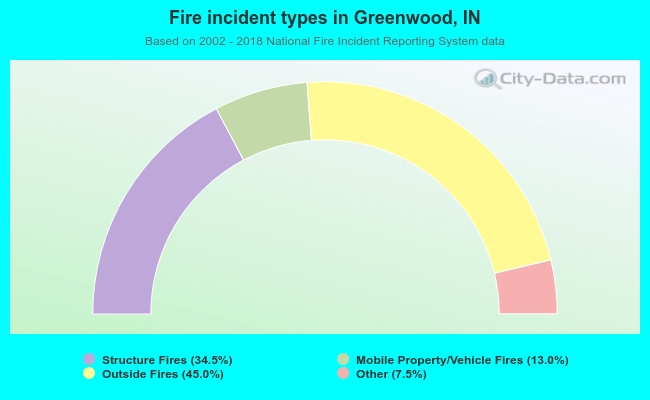 When looking into fire subcategories, the most reports belonged to: Outside Fires (45.0%), and Structure Fires (34.5%).