Franklin: Fire Incidents, Indiana (IN)
Where are fire incidents reported in Franklin, IN
Something went wrong! Please refresh the page.
| Fire incidents reported | |
|---|---|
| Sreet name | Count |
| MORTON ST | 142 |
| MAIN ST | 66 |
| JEFFERSON ST | 60 |
| HOSPITAL RD | 54 |
| INTERSTATE 65 | 42 |
| CENTERLINE RD | 40 |
| US 31 | 36 |
| KING ST | 34 |
| YANDES ST | 30 |
| MONROE ST | 28 |
| STATE ST | 28 |
| ADAMS ST | 26 |
| CRESCENT ST | 24 |
| HURRICANE ST | 24 |
| YOUNCE ST | 24 |
| MADISON ST | 22 |
| GRAHAM RD | 20 |
| JOHNSON AVE | 20 |
| LAKESIDE DR | 20 |
| TRADITIONS CT | 20 |
| LAKEVIEW CIR | 18 |
| LOCHRY RD | 18 |
| MAUXFERRY RD | 18 |
| OLD US 31 | 18 |
| SCHOOLHOUSE RD | 18 |
| US 31 HWY | 18 |
| US31 | 18 |
| WATER ST | 18 |
| DIVISION RD | 16 |
| NORTHWOOD PLAZA DR | 16 |
| Other | 382 |
2003 - 2017 National Fire Incident Reporting System (NFIRS) incidents
- Incident types reported to NFIRS in Franklin, IN
- 4,42157.6%Rescue & EMS
- 1,31817.2%Fire
- 82510.7%Hazardous Condition
- 4936.4%Good Intent Call
- 4005.2%False Alarm
- 1782.3%Service Call
- 300.4%Special Incident
- 100.1%Overpressure Rupture
- Fire incident types reported to NFIRS in Franklin, IN
- 51338.9%Outside Fires
- 35627.0%Structure Fires
- 22717.2%Other
- 22216.8%Mobile Property/Vehicle Fires
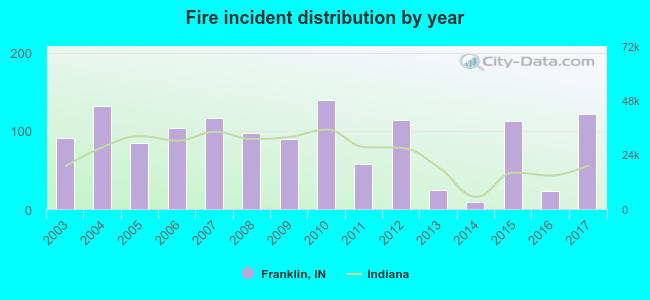 According to the data from the years 2003 - 2017 the average number of fire incidents per year is 88. The highest number of reported fire incidents - 139 took place in 2010, and the least - 9 in 2014. The data has an increasing trend.
The average number of yearly fire incidents per 10k residents in Franklin, IN compared to nearest cities:
(Note: Based on data for the last 3 years, including only cities with population 5,000 and above)
| Franklin: | 20.0 |
| New Whiteland: | 22.9 |
| Bargersville: | 39.2 |
| Greenwood: | 12.8 |
| Shelbyville: | 38.1 |
| Beech Grove: | 10.3 |
| Mooresville: | 102.3 |
| Martinsville: | 76.9 |
| Columbus: | 37.4 |
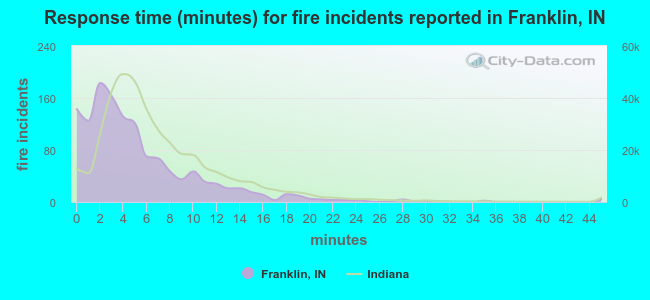 The median response time based on all reported fire incidents is 4 minutes. This is lower than the state median value.
The median response time in Franklin, IN compared to nearest cities:
(Note: Based on data for all years, including only cities with at least 500 fire incidents)
| Franklin: | 4 minutes |
| Bargersville: | 7 minutes |
| Greenwood: | 6 minutes |
| Edinburgh: | 7 minutes |
| Fairland: | 8 minutes |
| Shelbyville: | 5 minutes |
| Beech Grove: | 4 minutes |
| New Palestine: | 6 minutes |
| Mooresville: | 6 minutes |
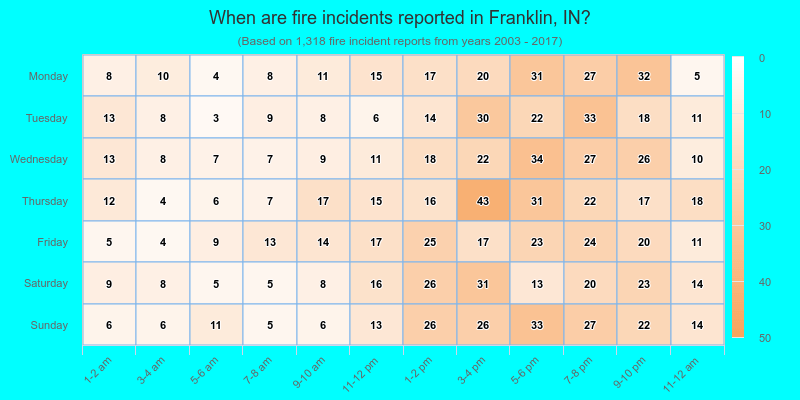
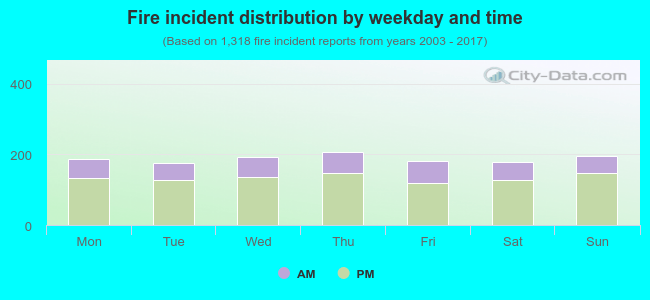 28.8% incidents where reported in the morning and 71.2% in the evening. The most fires (15.8%) took place on Thursday, and the least (13.3%) on Tuesday.
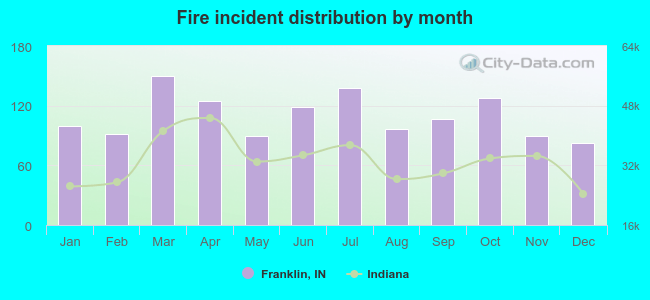 According to the 1,318 reports from years 2003 - 2017 most fires (11.4%) took place during March, and the least (6.2%) in December.
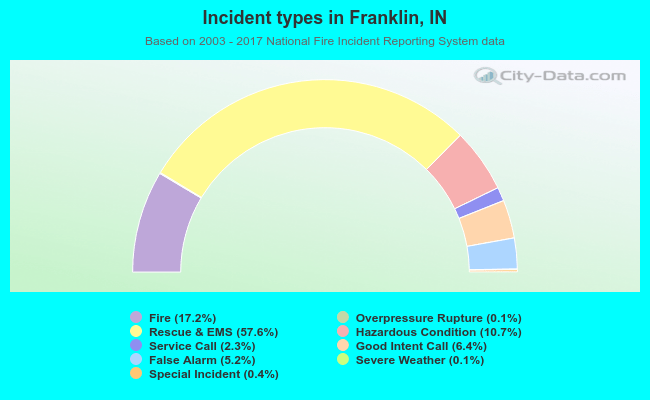 Out of all 7,681 cases reported during the years 2003 - 2017, the most belonged to the categories: Rescue & EMS (57.6%), Fire (17.2%), and Hazardous Condition (10.7%).
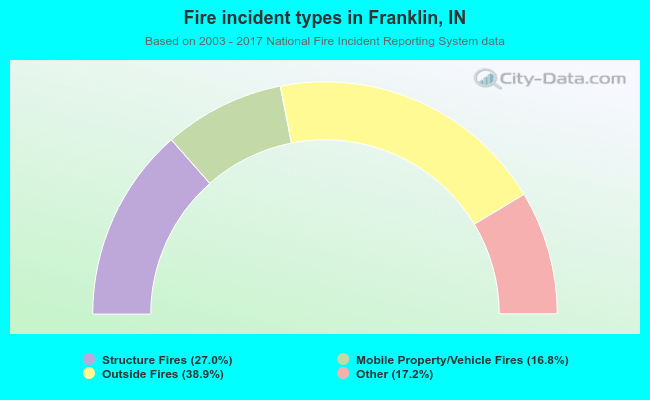 When looking into fire subcategories, the most reports belonged to: Outside Fires (38.9%), and Structure Fires (27.0%).