Shelbyville: Fire Incidents, Indiana (IN)
Where are fire incidents reported in Shelbyville, IN
Something went wrong! Please refresh the page.
| Fire incidents reported | |
|---|---|
| Sreet name | Count |
| STATE ROAD 44 | 110 |
| MICHIGAN RD | 88 |
| MILLER AVE | 70 |
| RILEY HWY | 66 |
| FRANKLIN ST | 58 |
| MILLER ST | 52 |
| WASHINGTON ST | 52 |
| INTERSTATE 74 | 50 |
| MORRISTOWN RD | 50 |
| MCKAY RD | 46 |
| STATE ROAD 9 | 46 |
| BROADWAY ST | 44 |
| MECHANIC ST | 42 |
| BOGGSTOWN RD | 40 |
| ELIZABETH ST | 40 |
| NOBLE ST | 40 |
| TAYLOR ST | 40 |
| 425 | 38 |
| HARRISON ST | 38 |
| MAUSOLEUM RD | 38 |
| 125 | 36 |
| 400 | 36 |
| 200 | 32 |
| 600 | 30 |
| WEST ST | 30 |
| 350 | 28 |
| HALE RD | 26 |
| HENDRICKS ST | 26 |
| HOWARD ST | 26 |
| AMOS RD | 24 |
| Other | 376 |
2003 - 2017 National Fire Incident Reporting System (NFIRS) incidents
- Incident types reported to NFIRS in Shelbyville, IN
- 8,01566.0%Rescue & EMS
- 1,71814.2%Fire
- 7055.8%Hazardous Condition
- 6785.6%Service Call
- 5864.8%Good Intent Call
- 4023.3%False Alarm
- 200.2%Overpressure Rupture
- Fire incident types reported to NFIRS in Shelbyville, IN
- 78145.5%Outside Fires
- 57033.2%Structure Fires
- 28716.7%Mobile Property/Vehicle Fires
- 804.7%Other
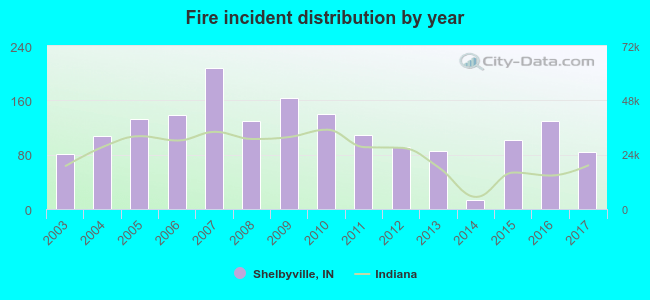 Based on the data from the years 2003 - 2017 the average number of fire incidents per year is 114. The highest number of reported fires - 208 took place in 2007, and the least - 13 in 2014. The data has a growing trend.
The average number of yearly fire incidents per 10k residents in Shelbyville, IN compared to nearest cities:
(Note: Based on data for the last 3 years, including only cities with population 5,000 and above)
| Shelbyville: | 38.1 |
| Franklin: | 20.0 |
| New Whiteland: | 22.9 |
| Rushville: | 30.3 |
| Greenfield: | 36.8 |
| Greenwood: | 12.8 |
| Greensburg: | 53.0 |
| Bargersville: | 39.2 |
| Beech Grove: | 10.3 |
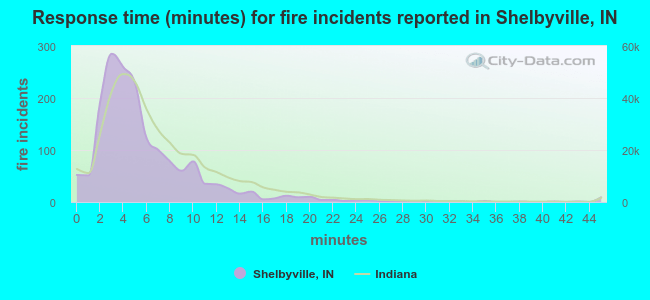 The median response time based on all reported fire incidents is 5 minutes. This is lower compared to the state median value.
The median response time in Shelbyville, IN compared to nearest cities:
(Note: Based on data for all years, including only cities with at least 500 fire incidents)
| Shelbyville: | 5 minutes |
| Fairland: | 8 minutes |
| Franklin: | 4 minutes |
| New Palestine: | 6 minutes |
| Edinburgh: | 7 minutes |
| Rushville: | 5 minutes |
| Greenfield: | 6 minutes |
| Greenwood: | 6 minutes |
| Greensburg: | 6 minutes |
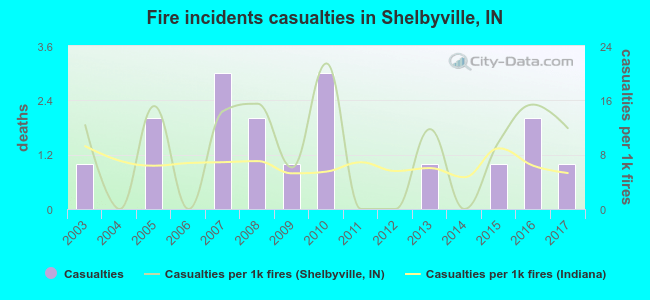 Based on the data from the years 2003 - 2017 the average number of fire-related yearly casualties is 1. The highest number of reported injuries - 3 took place in 2007, and the lowest - 0 in 2004. The data has a constant trend.
The average number of injuries per 1,000 fire incidents is 9. This indicator was the highest - 21 in 2010, and the lowest 0 in 2004. The trend for injuries per 1,000 incidents is dropping. Compared to the state value the number of casualties per 1,000 fire incidents is higher.
Based on the data from the years 2003 - 2017 the average number of fire-related yearly casualties is 1. The highest number of reported injuries - 3 took place in 2007, and the lowest - 0 in 2004. The data has a constant trend.
The average number of injuries per 1,000 fire incidents is 9. This indicator was the highest - 21 in 2010, and the lowest 0 in 2004. The trend for injuries per 1,000 incidents is dropping. Compared to the state value the number of casualties per 1,000 fire incidents is higher.Casualties per 1,000 incidents in Shelbyville, IN compared to nearest cities:
(Note: Based on data for all years, including only cities with at least 500 fire incidents)
| Shelbyville: | 9.9 |
| Fairland: | 1.6 |
| Franklin: | 0.8 |
| New Palestine: | 6.5 |
| Edinburgh: | 5.3 |
| Rushville: | 4.1 |
| Greenfield: | 13.0 |
| Greenwood: | 5.9 |
| Greensburg: | 5.6 |
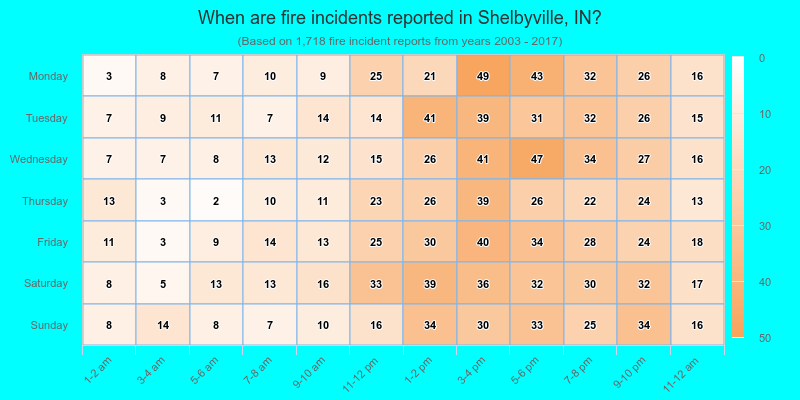
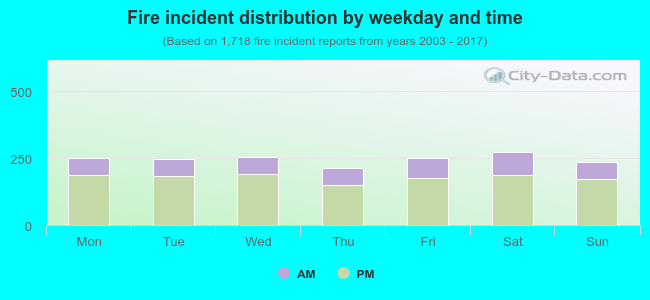 27.6% incidents where reported in the morning and 72.4% in the evening. The most fires (15.9%) took place on Saturday, and the least (12.3%) on Thursday.
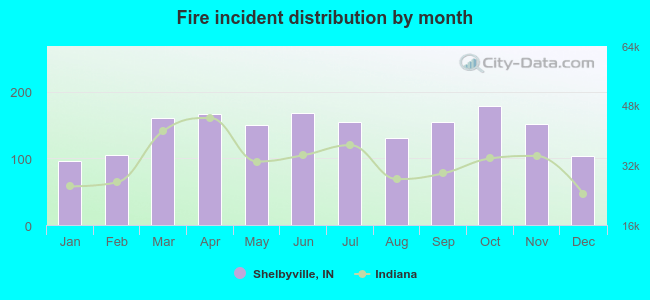 According to the 1,718 fires from years 2003 - 2017 most fires (10.4%) took place during October, and the least (5.6%) in January.
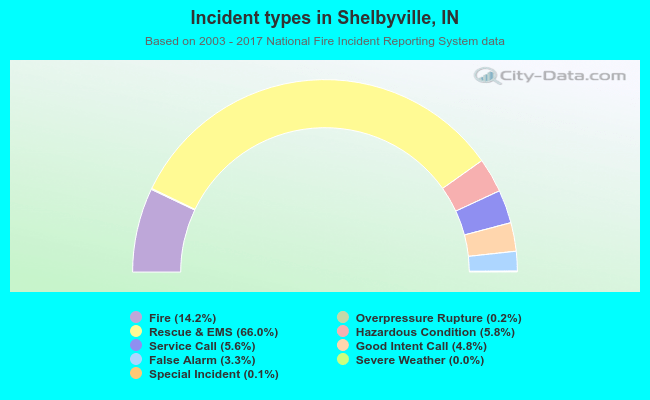 Out of all 12,138 cases reported during the years 2003 - 2017, the most belonged to the categories: Rescue & EMS (66.0%), Fire (14.2%), and Hazardous Condition (5.8%).
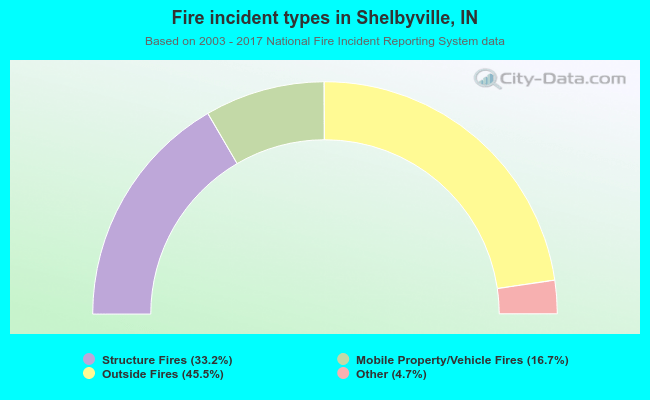 When looking into fire subcategories, the most reports belonged to: Outside Fires (45.5%), and Structure Fires (33.2%).