Farmingville: Fire Incidents, New York (NY)
Where are fire incidents reported in Farmingville, NY
Something went wrong! Please refresh the page.
|
| |||||||||||||||||||||||||||||||||||||||||||||||||||||||||||||||||||||||||||||||||||||||||||||||||||||||||||||
2006 - 2018 National Fire Incident Reporting System (NFIRS) incidents
- Incident types reported to NFIRS in Farmingville, NY
- 5,69573.1%Rescue & EMS
- 81810.5%False Alarm
- 5346.9%Good Intent Call
- 3324.3%Hazardous Condition
- 2383.1%Fire
- 1552.0%Service Call
- 100.1%Special Incident
- Fire incident types reported to NFIRS in Farmingville, NY
- 14460.5%Structure Fires
- 7732.4%Outside Fires
- 104.2%Other
- 72.9%Mobile Property/Vehicle Fires
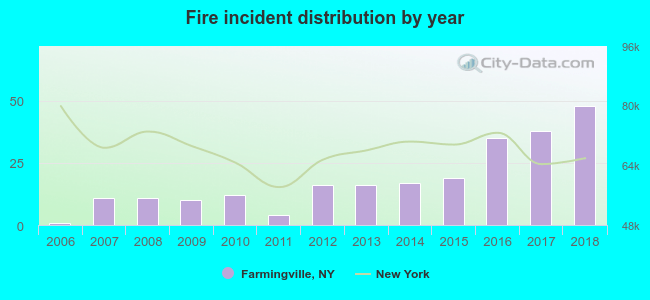 Based on the data from the years 2006 - 2018 the average number of fire incidents per year is 18. The highest number of reported fires - 48 took place in 2018, and the least - 1 in 2006. The data has a growing trend.
The average number of yearly fire incidents per 10k residents in Farmingville, NY compared to nearest cities:
(Note: Based on data for the last 3 years, including only cities with population 5,000 and above)
| Farmingville: | 26.1 |
| Selden: | 31.9 |
| Holtsville: | 9.6 |
| Centereach: | 9.9 |
| Holbrook: | 12.7 |
| Medford: | 37.3 |
| Lake Ronkonkoma: | 1.0 |
| Coram: | 17.3 |
| Lake Grove: | 10.4 |
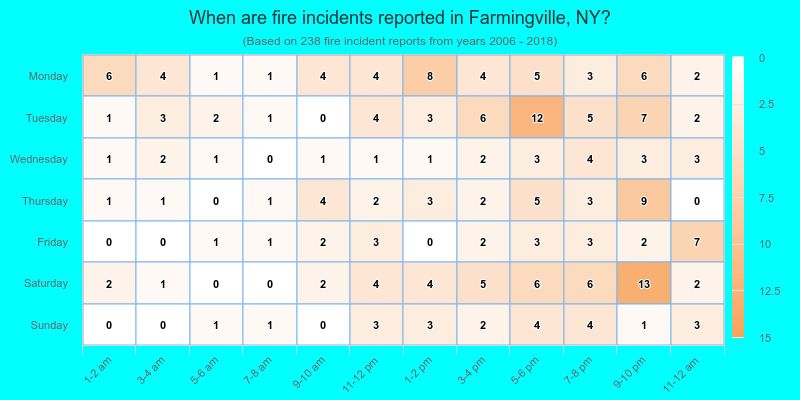
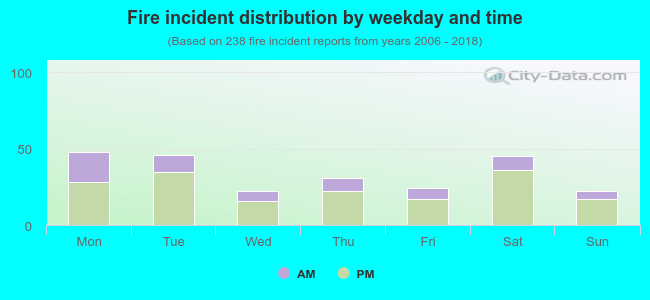 28.2% incidents where reported in the morning and 71.8% in the evening. The most fires (20.2%) took place on Monday, and the least (9.2%) on Wednesday.
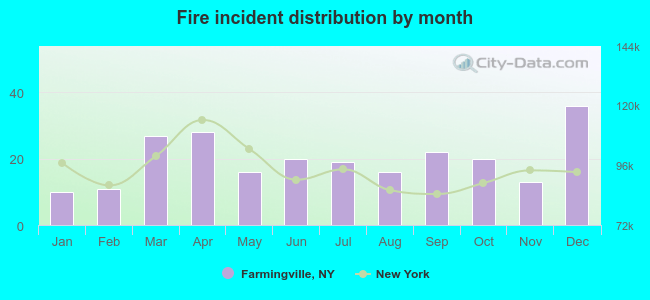 According to the 238 incident reports from years 2006 - 2018 most fires (15.1%) took place during December, and the least (4.2%) in January.
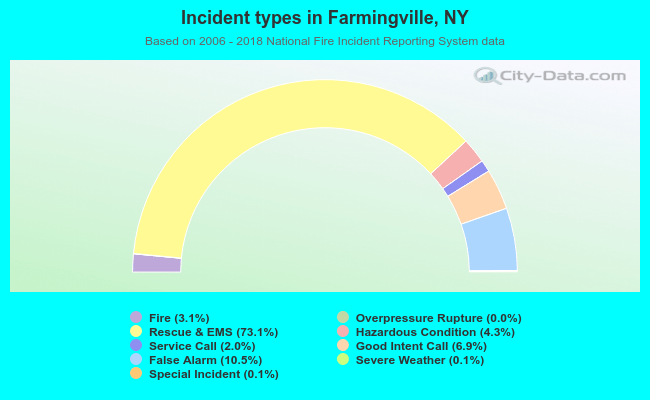 Out of all 7,791 cases reported during the years 2006 - 2018, the most belonged to the categories: Rescue & EMS (73.1%), False Alarm (10.5%), and Good Intent Call (6.9%).
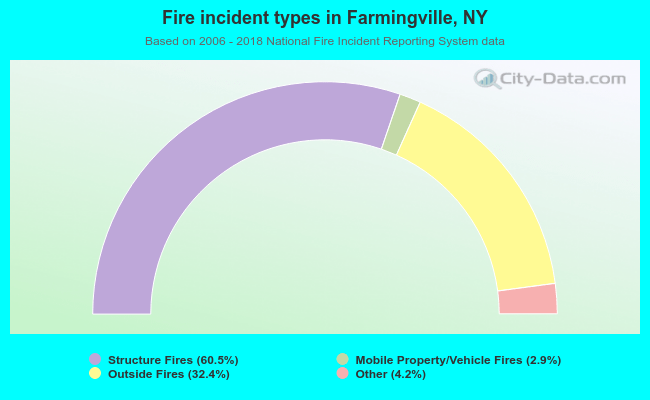 When looking into fire subcategories, the most reports belonged to: Structure Fires (60.5%), and Outside Fires (32.4%).