Holtsville: Fire Incidents, New York (NY)
Where are fire incidents reported in Holtsville, NY
Something went wrong! Please refresh the page.
|
| |||||||||||||||||||||||||||||||||||||||||||||||||||||||||||||||||||||||||||||||||||||||||||||||||||||||||||||
2004 - 2018 National Fire Incident Reporting System (NFIRS) incidents
- Incident types reported to NFIRS in Holtsville, NY
- 2,15758.4%Rescue & EMS
- 43111.7%Fire
- 40110.9%False Alarm
- 3669.9%Hazardous Condition
- 2526.8%Good Intent Call
- 822.2%Service Call
- Fire incident types reported to NFIRS in Holtsville, NY
- 17640.8%Outside Fires
- 15536.0%Structure Fires
- 7316.9%Mobile Property/Vehicle Fires
- 276.3%Other
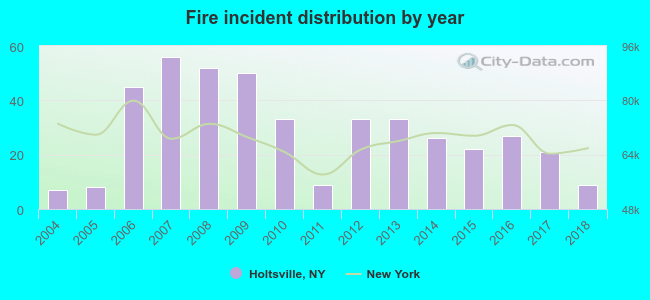 According to the data from the years 2004 - 2018 the average number of fires per year is 29. The highest number of reported fires - 56 took place in 2007, and the least - 7 in 2004. The data has an increasing trend.
The average number of yearly fire incidents per 10k residents in Holtsville, NY compared to nearest cities:
(Note: Based on data for the last 3 years, including only cities with population 5,000 and above)
| Holtsville: | 9.6 |
| Holbrook: | 12.7 |
| Farmingville: | 26.1 |
| North Patchogue: | 2.3 |
| Medford: | 37.3 |
| Lake Ronkonkoma: | 1.0 |
| Patchogue: | 85.5 |
| Selden: | 31.9 |
| Ronkonkoma: | 43.0 |
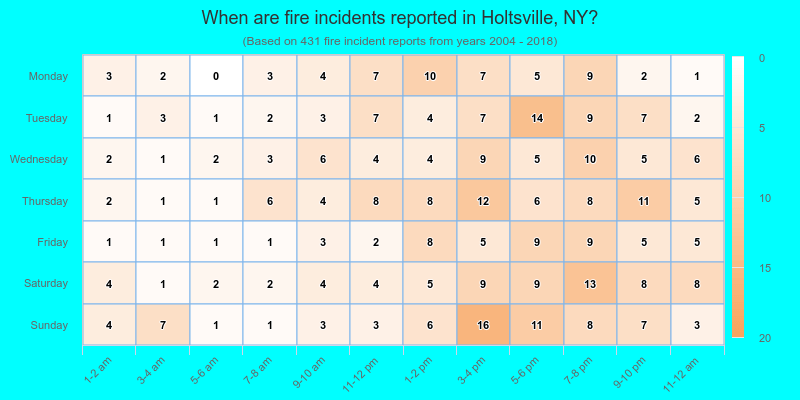
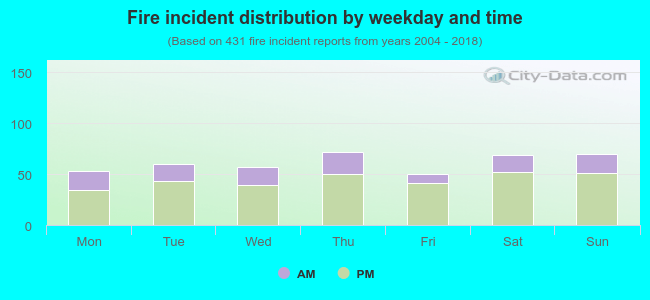 28.1% incidents where reported in the morning and 71.9% in the evening. The most fires (16.7%) took place on Thursday, and the least (11.6%) on Friday.
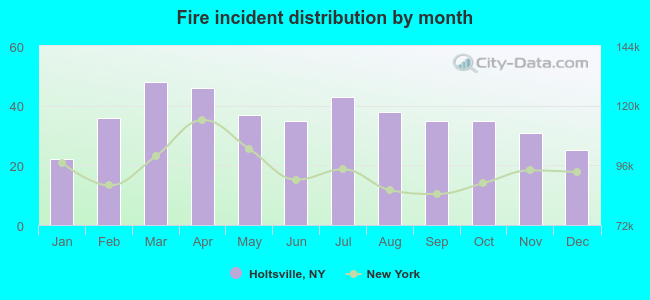 According to the 431 fire incidents from years 2004 - 2018 most fires (11.1%) took place during March, and the least (5.1%) in January.
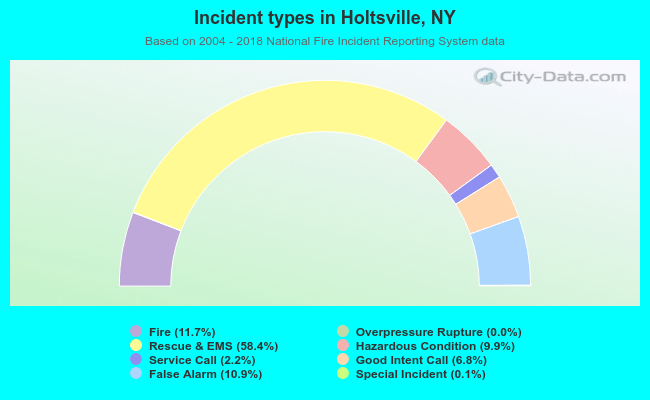 Out of all 3,693 cases reported during the years 2004 - 2018, the most belonged to the categories: Rescue & EMS (58.4%), Fire (11.7%), and False Alarm (10.9%).
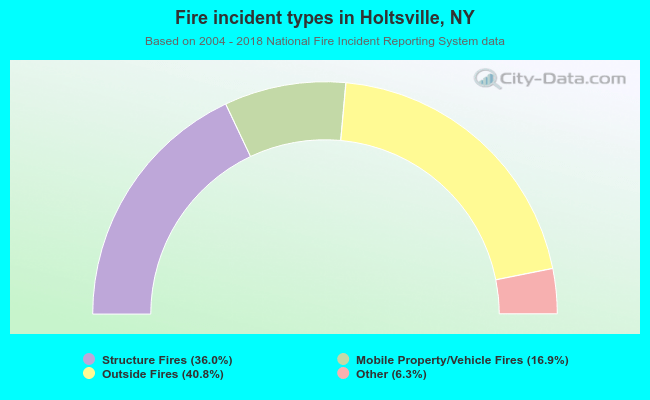 When looking into fire subcategories, the most reports belonged to: Outside Fires (40.8%), and Structure Fires (36.0%).