Medford: Fire Incidents, New York (NY)
Where are fire incidents reported in Medford, NY
Something went wrong! Please refresh the page.
| Fire incidents reported | |
|---|---|
| Sreet name | Count |
| RT 112 | 180 |
| HORSEBLOCK RD | 128 |
| PECONIC AVE | 120 |
| LIE | 62 |
| CR 101 | 46 |
| SIPP AVE | 44 |
| HORSE BLOCK RD | 38 |
| OREGON AVE | 34 |
| OLD MEDFORD AVE | 32 |
| SOUTHAVEN AVE | 32 |
| BIRCHWOOD RD | 30 |
| JAMAICA AVE | 30 |
| BUFFALO AVE | 28 |
| ROBINSON AVE | 28 |
| LONG ISLAND AVE | 26 |
| EXPRESS DR S | 24 |
| BLUE RIDGE DR | 22 |
| CEDARHURST AVE | 22 |
| MIDDLE ISLAND RD | 22 |
| N OCEAN AVE | 22 |
| WAVERLY AVE | 20 |
| WAVE AVE | 18 |
| WOODSIDE AVE | 18 |
| GRANNY RD | 16 |
| MAPLE ST | 16 |
| MUNSELL RD | 16 |
| EXPRESS DR N | 14 |
| OAK ST | 14 |
| ACORN AVE | 12 |
| INDUSTRIAL BLVD | 12 |
2004 - 2018 National Fire Incident Reporting System (NFIRS) incidents
- Incident types reported to NFIRS in Medford, NY
- 1,84328.1%Hazardous Condition
- 1,46322.3%False Alarm
- 1,41021.5%Rescue & EMS
- 1,06516.2%Fire
- 5628.6%Good Intent Call
- 2023.1%Service Call
- 70.1%Overpressure Rupture
- 70.1%Severe Weather
- Fire incident types reported to NFIRS in Medford, NY
- 47844.9%Outside Fires
- 35833.6%Structure Fires
- 18016.9%Mobile Property/Vehicle Fires
- 494.6%Other
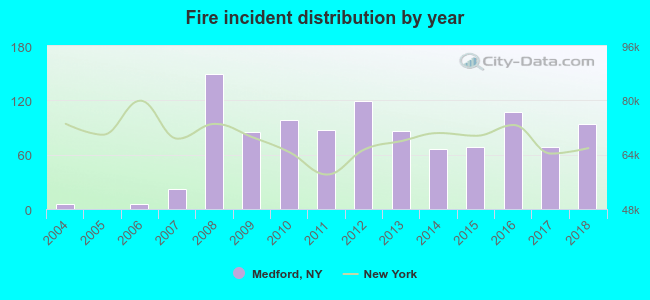 Based on the data from the years 2004 - 2018 the average number of fire incidents per year is 71. The highest number of fires - 149 took place in 2008, and the least - 0 in 2005. The data has an increasing trend.
The average number of yearly fire incidents per 10k residents in Medford, NY compared to nearest cities:
(Note: Based on data for the last 3 years, including only cities with population 5,000 and above)
| Medford: | 37.3 |
| North Patchogue: | 2.3 |
| Holtsville: | 9.6 |
| Yaphank: | 26.4 |
| East Patchogue: | 22.5 |
| Farmingville: | 26.1 |
| Patchogue: | 85.5 |
| Holbrook: | 12.7 |
| Selden: | 31.9 |
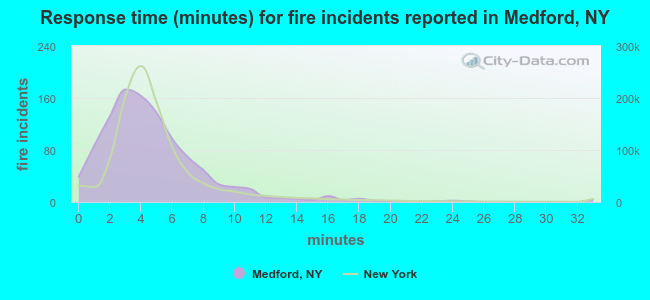 The median response time based on all reported fire incidents is 4 minutes. This is close to the New York median value.
The median response time in Medford, NY compared to nearest cities:
(Note: Based on data for all years, including only cities with at least 500 fire incidents)
| Medford: | 4 minutes |
| East Patchogue: | 4 minutes |
| Patchogue: | 4 minutes |
| Bellport: | 5 minutes |
| Holbrook: | 4 minutes |
| Selden: | 4 minutes |
| Middle Island: | 7 minutes |
| Coram: | 6 minutes |
| Shirley: | 7 minutes |
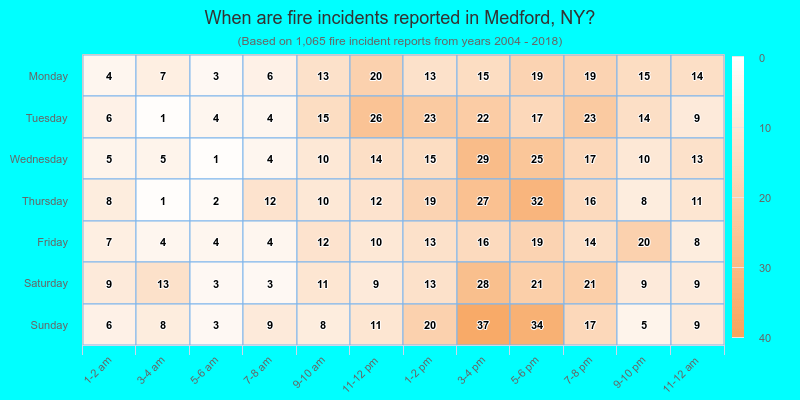
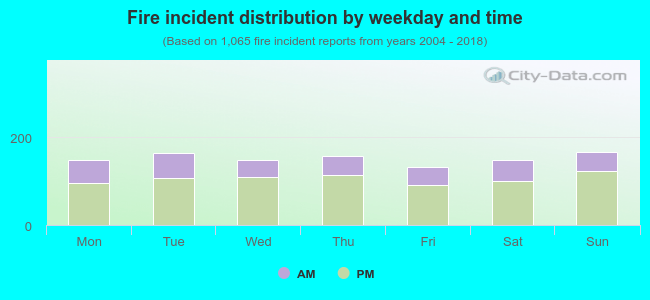 30.7% incidents where reported in the morning and 69.3% in the evening. The most fires (15.7%) took place on Sunday, and the least (12.3%) on Friday.
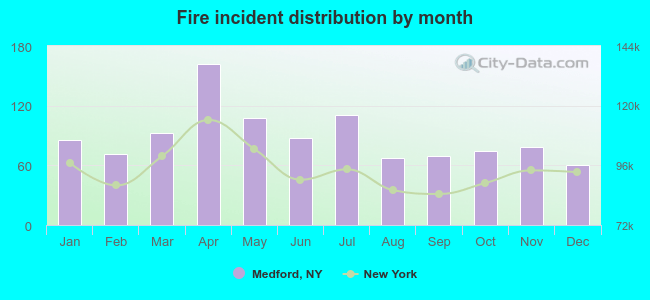 Based on the 1,065 fires from years 2004 - 2018 most fires (15.2%) took place during April, and the least (5.6%) in December.
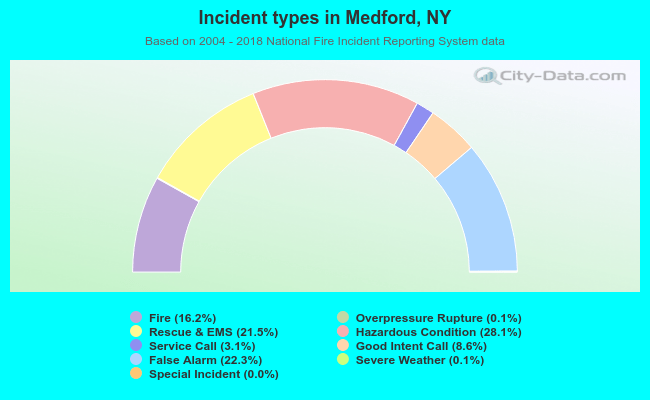 Out of all 6,560 cases reported during the years 2004 - 2018, the most belonged to the categories: Hazardous Condition (28.1%), False Alarm (22.3%), and Rescue & EMS (21.5%).
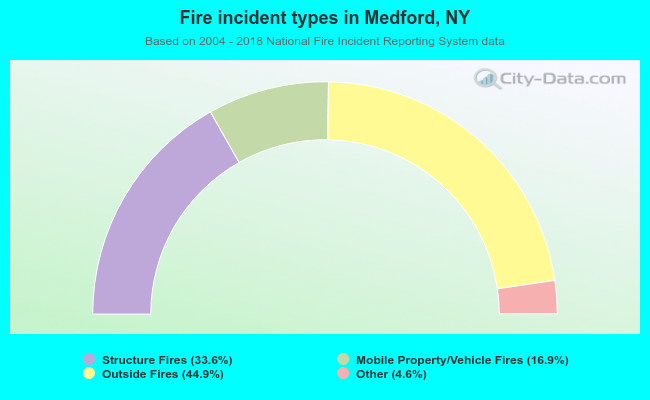 When looking into fire subcategories, the most reports belonged to: Outside Fires (44.9%), and Structure Fires (33.6%).