Fishers: Fire Incidents, Indiana (IN)
Where are fire incidents reported in Fishers, IN
Something went wrong! Please refresh the page.
| Fire incidents reported | |
|---|---|
| Sreet name | Count |
| 116TH ST | 358 |
| I 69 | 76 |
| ALLISONVILLE RD | 74 |
| 96TH ST | 70 |
| 126TH ST | 66 |
| 131ST ST | 38 |
| 106TH ST | 30 |
| 121ST ST | 30 |
| CUMBERLAND RD | 28 |
| OLIO RD | 26 |
| 136TH ST | 22 |
| PROMISE RD | 22 |
| BROOKS SCHOOL RD | 20 |
| LANTERN RD | 20 |
| NORTH BY NORTHEAST BLVD | 20 |
| ELLER RD | 18 |
| NIAGARA DR | 18 |
| ORANGE BLOSSOM TRL | 18 |
| COMMERCIAL DR | 16 |
| SUNRISE CIR | 16 |
| 141ST ST | 14 |
| I 69 N | 14 |
| PARKSIDE DR | 14 |
| SOUTHEASTERN PKY | 14 |
| TOLL HOUSE WAY | 14 |
| I 69 S | 12 |
| MADDEN DR | 12 |
| WOODS EDGE DR | 12 |
| BELLINGHAM BLVD | 10 |
| CLARK DR | 10 |
| Other | 178 |
2003 - 2016 National Fire Incident Reporting System (NFIRS) incidents
- Incident types reported to NFIRS in Fishers, IN
- 4,70948.9%Rescue & EMS
- 1,30213.5%Hazardous Condition
- 1,29013.4%Fire
- 9009.3%False Alarm
- 7487.8%Good Intent Call
- 6336.6%Service Call
- 320.3%Severe Weather
- Fire incident types reported to NFIRS in Fishers, IN
- 56944.1%Outside Fires
- 53941.8%Structure Fires
- 16913.1%Mobile Property/Vehicle Fires
- 131.0%Other
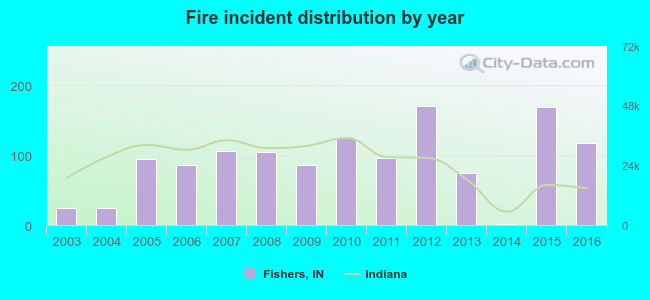 Based on the data from the years 2003 - 2016 the average number of fires per year is 92. The highest number of fires - 171 took place in 2012, and the least - 2 in 2014. The data has a rising trend.
The average number of yearly fire incidents per 10k residents in Fishers, IN compared to nearest cities:
(Note: Based on data for the last 3 years, including only cities with population 5,000 and above)
| Fishers: | 4.8 |
| Carmel: | 2.9 |
| McCordsville: | 29.4 |
| Noblesville: | 17.4 |
| Lawrence: | 15.2 |
| Westfield: | 17.8 |
| Indianapolis: | 5.2 |
| Zionsville: | 16.1 |
| Speedway: | 40.2 |
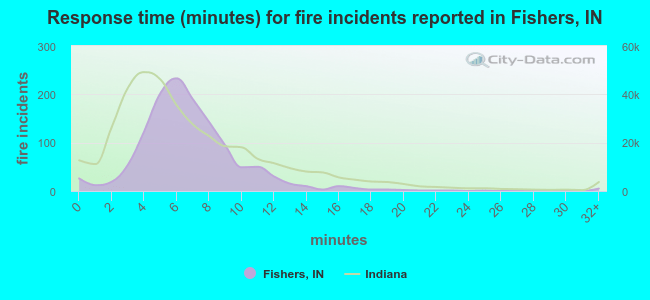 The median response time based on all reported fire incidents is 6 minutes. This is similar to the Indiana median value.
The median response time in Fishers, IN compared to nearest cities:
(Note: Based on data for all years, including only cities with at least 500 fire incidents)
| Fishers: | 6 minutes |
| Carmel: | 6 minutes |
| Noblesville: | 6 minutes |
| Westfield: | 7 minutes |
| Indianapolis: | 6 minutes |
| Zionsville: | 6 minutes |
| Pendleton: | 8 minutes |
| Sheridan: | 8 minutes |
| Beech Grove: | 4 minutes |
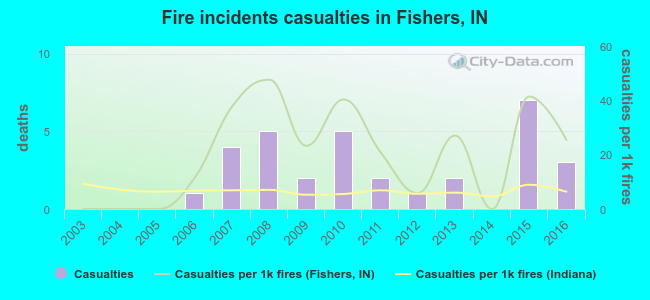 According to the data from the years 2003 - 2016 the average number of fire-related casualties per year is 2. The highest number of reported casualties - 7 took place in 2015, and the lowest - 0 in 2003. The data has an increasing trend.
The average number of casualties per 1,000 fire incidents is 20. This indicator was the highest - 48 in 2008, and the lowest 0 in 2003. The trend for casualties per 1,000 fire incidents is increasing. Compared to the state value the number of injuries per 1,000 fires is much higher.
According to the data from the years 2003 - 2016 the average number of fire-related casualties per year is 2. The highest number of reported casualties - 7 took place in 2015, and the lowest - 0 in 2003. The data has an increasing trend.
The average number of casualties per 1,000 fire incidents is 20. This indicator was the highest - 48 in 2008, and the lowest 0 in 2003. The trend for casualties per 1,000 fire incidents is increasing. Compared to the state value the number of injuries per 1,000 fires is much higher.Casualties per 1,000 incidents in Fishers, IN compared to nearest cities:
(Note: Based on data for all years, including only cities with at least 500 fire incidents)
| Fishers: | 24.8 |
| Carmel: | 13.3 |
| Noblesville: | 11.0 |
| Westfield: | 26.5 |
| Indianapolis: | 4.7 |
| Zionsville: | 0.9 |
| Pendleton: | 1.7 |
| Sheridan: | 4.3 |
| Beech Grove: | 21.4 |
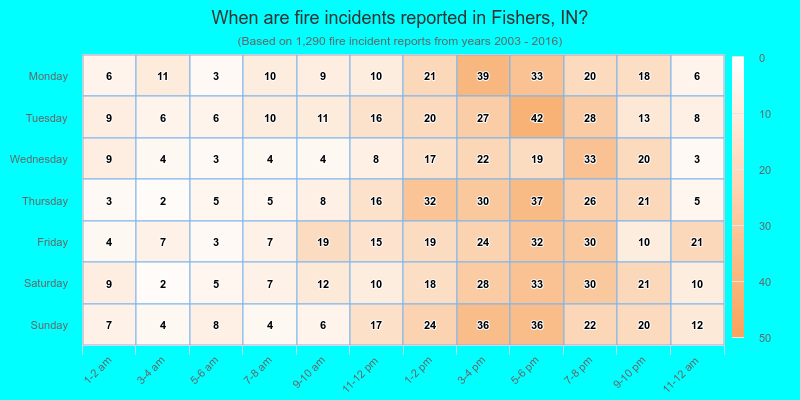
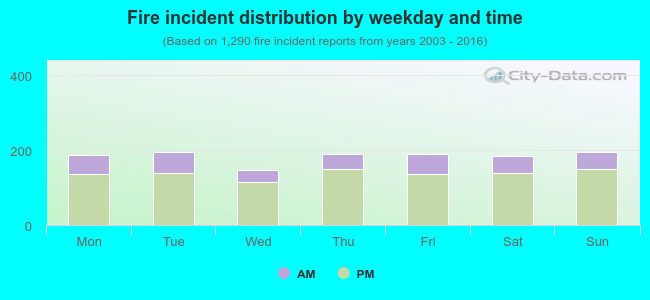 25.1% incidents where reported in the morning and 74.9% in the evening. The most fires (15.2%) took place on Tuesday, and the least (11.3%) on Wednesday.
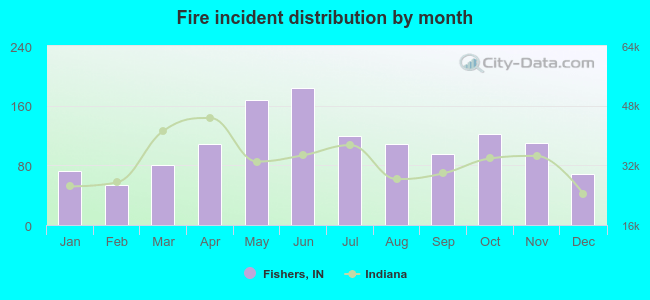 Based on the 1,290 fires from years 2003 - 2016 most fires (14.3%) took place during June, and the least (4.2%) in February.
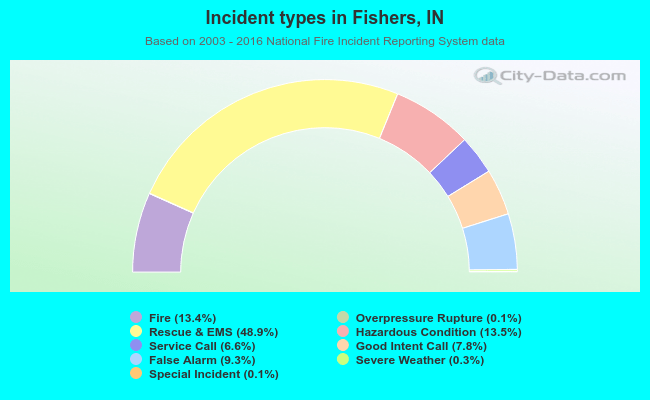 Out of all 9,628 cases reported during the years 2003 - 2016, the most belonged to the categories: Rescue & EMS (48.9%), Hazardous Condition (13.5%), and Fire (13.4%).
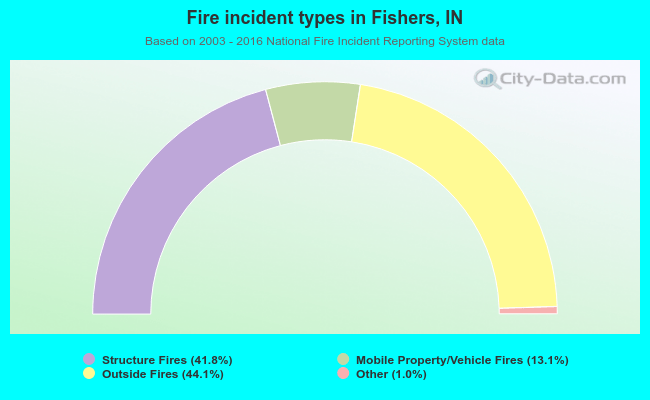 When looking into fire subcategories, the most reports belonged to: Outside Fires (44.1%), and Structure Fires (41.8%).