Carmel: Fire Incidents, Indiana (IN)
Where are fire incidents reported in Carmel, IN
Something went wrong! Please refresh the page.
| Fire incidents reported | |
|---|---|
| Sreet name | Count |
| 116TH ST | 114 |
| 146TH ST | 60 |
| 151ST ST | 60 |
| MERIDIAN ST | 52 |
| RANGELINE RD | 52 |
| US 31 | 48 |
| CARMEL DR | 46 |
| MAIN ST | 46 |
| MICHIGAN RD | 44 |
| GREYHOUND PASS | 42 |
| 106TH ST | 40 |
| 126TH ST | 36 |
| GOLFVIEW DR | 30 |
| TOWNE RD | 28 |
| CLAY TERRACE BLVD | 26 |
| HAZEL DELL PKY | 26 |
| ARBOR DR | 20 |
| RIVER RD | 20 |
| 136TH ST | 18 |
| THATCHER LN | 16 |
| 3RD AVE | 14 |
| CITY CENTER DR | 14 |
| GREYHOUND PASS | 14 |
| LAKESHORE DR | 14 |
| US 31 NORTH | 14 |
| 1ST AVE | 12 |
| GRAY RD | 12 |
| MOHAWK HILLS DR | 12 |
| SHELBORNE RD | 12 |
| WESTWOOD DR | 12 |
| Other | 328 |
2002 - 2017 National Fire Incident Reporting System (NFIRS) incidents
- Incident types reported to NFIRS in Carmel, IN
- 4,29142.6%Rescue & EMS
- 2,10220.8%Hazardous Condition
- 1,28212.7%Fire
- 9639.6%False Alarm
- 7147.1%Good Intent Call
- 6516.5%Service Call
- 330.3%Severe Weather
- 250.2%Overpressure Rupture
- 210.2%Special Incident
- Fire incident types reported to NFIRS in Carmel, IN
- 59046.0%Outside Fires
- 45635.6%Structure Fires
- 15712.2%Mobile Property/Vehicle Fires
- 796.2%Other
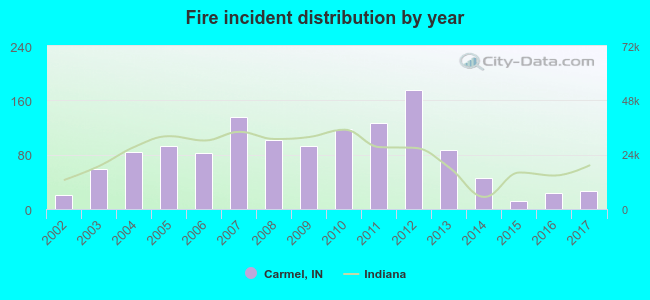 According to the data from the years 2002 - 2017 the average number of fire incidents per year is 80. The highest number of fire incidents - 175 took place in 2012, and the least - 12 in 2015. The data has a rising trend.
The average number of yearly fire incidents per 10k residents in Carmel, IN compared to nearest cities:
(Note: Based on data for the last 3 years, including only cities with population 5,000 and above)
| Carmel: | 2.9 |
| Westfield: | 17.8 |
| Fishers: | 4.8 |
| Noblesville: | 17.4 |
| Zionsville: | 16.1 |
| Lawrence: | 15.2 |
| McCordsville: | 29.4 |
| Whitestown: | 40.6 |
| Indianapolis: | 5.2 |
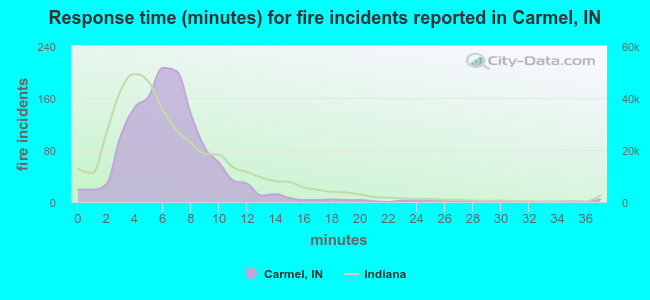 The median response time based on all reported fire incidents is 6 minutes. This is comparable to the state median value.
The median response time in Carmel, IN compared to nearest cities:
(Note: Based on data for all years, including only cities with at least 500 fire incidents)
| Carmel: | 6 minutes |
| Westfield: | 7 minutes |
| Fishers: | 6 minutes |
| Noblesville: | 6 minutes |
| Zionsville: | 6 minutes |
| Sheridan: | 8 minutes |
| Indianapolis: | 6 minutes |
| Beech Grove: | 4 minutes |
| Brownsburg: | 6 minutes |
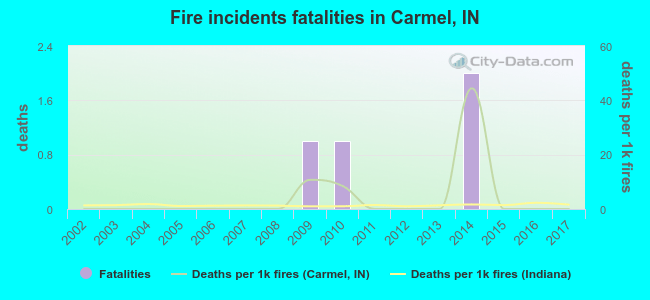 Based on the data from the years 2002 - 2017 the average number of fire-related yearly deaths is 0. The highest number of deaths - 2 took place in 2014, and the lowest - 0 in 2002. The data has a constant trend.
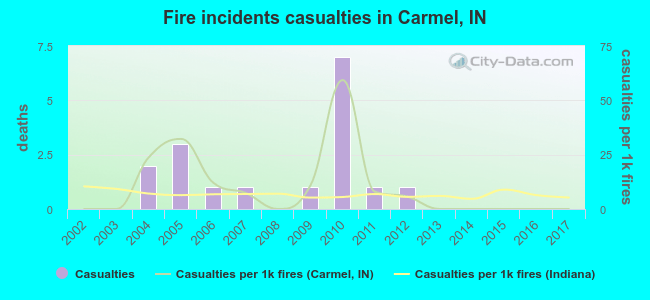 Based on the data from the years 2002 - 2017 the average number of fire-related casualties per year is 1. The highest number of reported injuries - 7 took place in 2010, and the lowest - 0 in 2002. The data has a constant trend.
The average number of casualties per 1,000 fires is 10. This indicator was the highest - 59 in 2010, and the lowest 0 in 2002. The trend for injuries per 1,000 fire incidents is constant. Compared to the Indiana value the number of injuries per 1,000 fires is higher.
Based on the data from the years 2002 - 2017 the average number of fire-related casualties per year is 1. The highest number of reported injuries - 7 took place in 2010, and the lowest - 0 in 2002. The data has a constant trend.
The average number of casualties per 1,000 fires is 10. This indicator was the highest - 59 in 2010, and the lowest 0 in 2002. The trend for injuries per 1,000 fire incidents is constant. Compared to the Indiana value the number of injuries per 1,000 fires is higher.Casualties per 1,000 incidents in Carmel, IN compared to nearest cities:
(Note: Based on data for all years, including only cities with at least 500 fire incidents)
| Carmel: | 13.3 |
| Westfield: | 26.5 |
| Fishers: | 24.8 |
| Noblesville: | 11.0 |
| Zionsville: | 0.9 |
| Sheridan: | 4.3 |
| Indianapolis: | 4.7 |
| Beech Grove: | 21.4 |
| Brownsburg: | 22.5 |
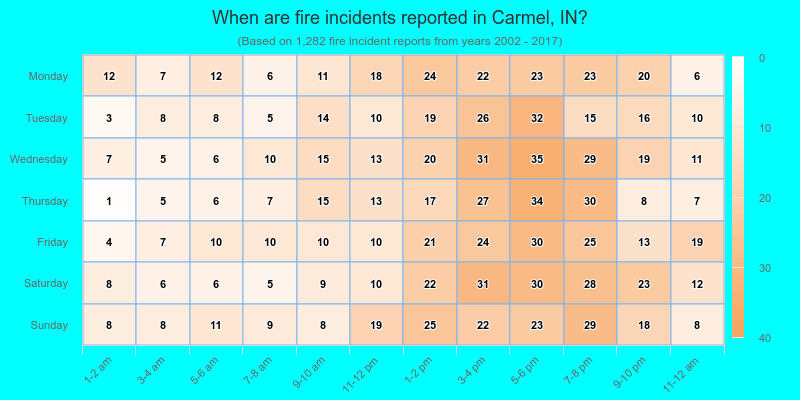
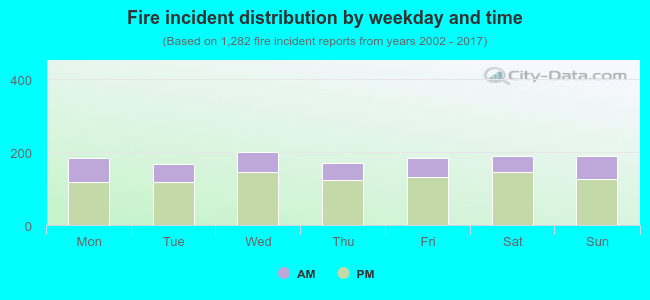 29.3% incidents where reported in the morning and 70.7% in the evening. The most fires (15.7%) took place on Wednesday, and the least (12.9%) on Tuesday.
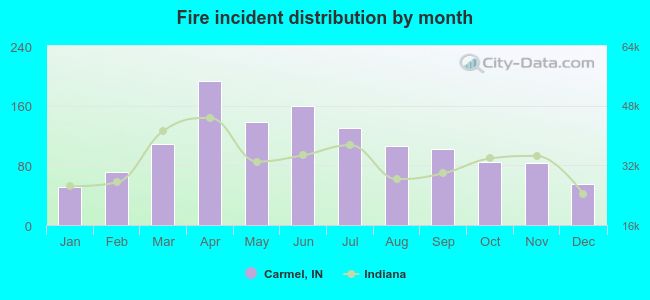 According to the 1,282 fire incident reports from years 2002 - 2017 most fires (15.1%) took place during April, and the least (4.0%) in January.
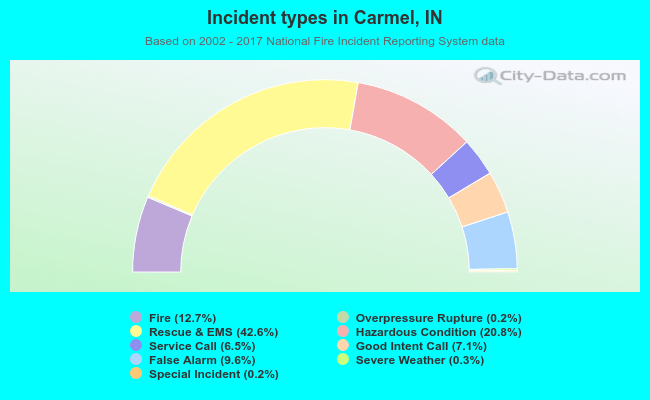 Out of all 10,082 cases reported during the years 2002 - 2017, the most belonged to the categories: Rescue & EMS (42.6%), Hazardous Condition (20.8%), and Fire (12.7%).
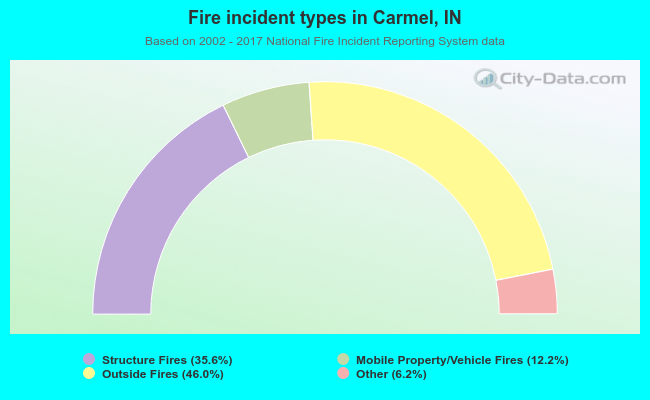 When looking into fire subcategories, the most reports belonged to: Outside Fires (46.0%), and Structure Fires (35.6%).