Westfield: Fire Incidents, Indiana (IN)
Where are fire incidents reported in Westfield, IN
Something went wrong! Please refresh the page.
| Fire incidents reported | |
|---|---|
| Sreet name | Count |
| SR 32 | 116 |
| US 31 | 104 |
| UNION ST | 88 |
| 191ST ST | 52 |
| 161ST ST | 44 |
| 186TH ST | 42 |
| SPRING MILL RD | 38 |
| EAGLETOWN RD | 32 |
| MAIN ST | 30 |
| 169TH ST | 24 |
| JOLIET RD | 22 |
| MAIN STREET | 22 |
| 156TH ST | 20 |
| TOMLINSON RD | 20 |
| 206TH ST | 18 |
| CAREY RD | 18 |
| PENN ST | 18 |
| 166TH ST | 16 |
| DARTOWN RD | 16 |
| DITCH RD | 16 |
| GRASSY BRANCH RD | 16 |
| HORTON RD | 16 |
| PINE RIDGE DR | 16 |
| US 31 NORTH | 16 |
| EAST ST | 14 |
| GRABILL DR | 14 |
| LITTLE EAGLE CREEK AVE | 14 |
| OAK RD | 14 |
| SPRINGMILL ROAD | 14 |
| WESTLEA DR | 14 |
| Other | 151 |
2002 - 2017 National Fire Incident Reporting System (NFIRS) incidents
- Incident types reported to NFIRS in Westfield, IN
- 4,30152.8%Rescue & EMS
- 1,05512.9%Fire
- 87110.7%Hazardous Condition
- 7178.8%Good Intent Call
- 6117.5%False Alarm
- 5206.4%Service Call
- 340.4%Severe Weather
- 260.3%Special Incident
- 170.2%Overpressure Rupture
- Fire incident types reported to NFIRS in Westfield, IN
- 46243.8%Structure Fires
- 43140.9%Outside Fires
- 10810.2%Mobile Property/Vehicle Fires
- 545.1%Other
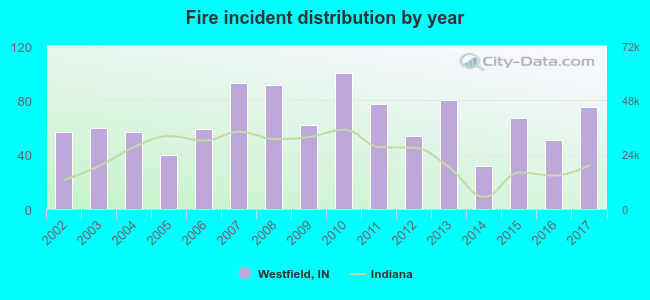 Based on the data from the years 2002 - 2017 the average number of fires per year is 66. The highest number of fires - 100 took place in 2010, and the least - 32 in 2014. The data has a rising trend.
The average number of yearly fire incidents per 10k residents in Westfield, IN compared to nearest cities:
(Note: Based on data for the last 3 years, including only cities with population 5,000 and above)
| Westfield: | 17.8 |
| Carmel: | 2.9 |
| Noblesville: | 17.4 |
| Fishers: | 4.8 |
| Zionsville: | 16.1 |
| Whitestown: | 40.6 |
| Lawrence: | 15.2 |
| McCordsville: | 29.4 |
| Indianapolis: | 5.2 |
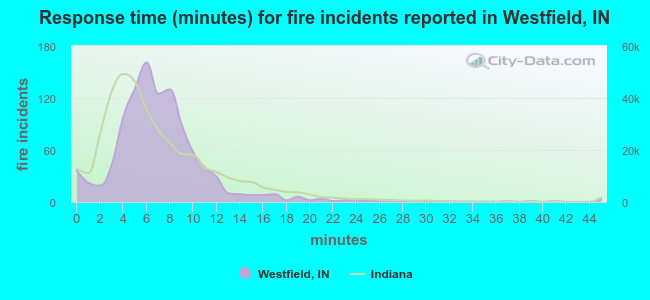 The median response time based on all reported fire incidents is 7 minutes. This is about the same as the Indiana median value.
The median response time in Westfield, IN compared to nearest cities:
(Note: Based on data for all years, including only cities with at least 500 fire incidents)
| Westfield: | 7 minutes |
| Carmel: | 6 minutes |
| Noblesville: | 6 minutes |
| Fishers: | 6 minutes |
| Sheridan: | 8 minutes |
| Zionsville: | 6 minutes |
| Indianapolis: | 6 minutes |
| Tipton: | 5 minutes |
| Lebanon: | 5 minutes |
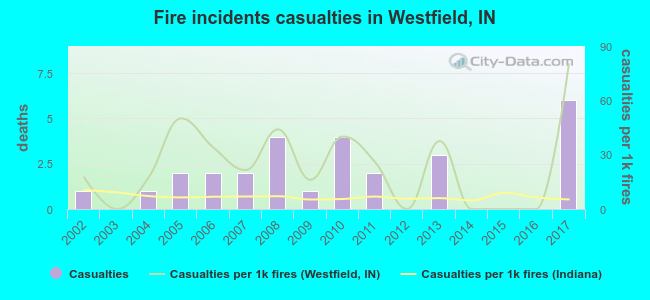 Based on the reports from the years 2002 - 2017 the average number of fire-related casualties per year is 2. The highest number of injuries - 6 took place in 2017, and the lowest - 0 in 2003. The data has a rising trend.
The average number of injuries per 1,000 fire incidents is 24. This indicator was the highest - 80 in 2017, and the lowest 0 in 2003. The trend for casualties per 1,000 incidents is growing. Compared to the Indiana value the number of casualties per 1,000 fires is much higher.
Based on the reports from the years 2002 - 2017 the average number of fire-related casualties per year is 2. The highest number of injuries - 6 took place in 2017, and the lowest - 0 in 2003. The data has a rising trend.
The average number of injuries per 1,000 fire incidents is 24. This indicator was the highest - 80 in 2017, and the lowest 0 in 2003. The trend for casualties per 1,000 incidents is growing. Compared to the Indiana value the number of casualties per 1,000 fires is much higher.Casualties per 1,000 incidents in Westfield, IN compared to nearest cities:
(Note: Based on data for all years, including only cities with at least 500 fire incidents)
| Westfield: | 26.5 |
| Carmel: | 13.3 |
| Noblesville: | 11.0 |
| Fishers: | 24.8 |
| Sheridan: | 4.3 |
| Zionsville: | 0.9 |
| Indianapolis: | 4.7 |
| Tipton: | 5.2 |
| Lebanon: | 16.4 |
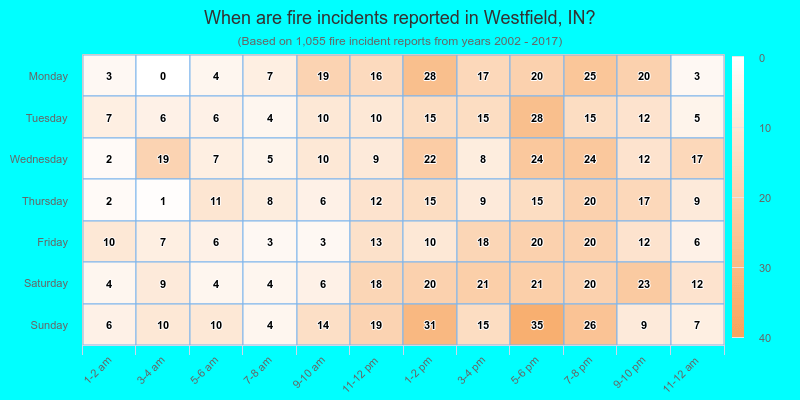
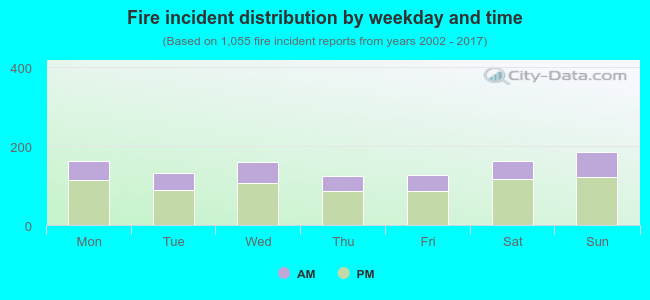 31.7% incidents where reported in the morning and 68.3% in the evening. The most fires (17.6%) took place on Sunday, and the least (11.8%) on Thursday.
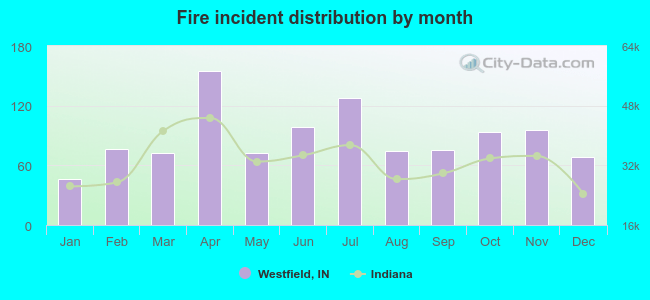 Based on the 1,055 fire incident reports from years 2002 - 2017 most fires (14.7%) took place during April, and the least (4.4%) in January.
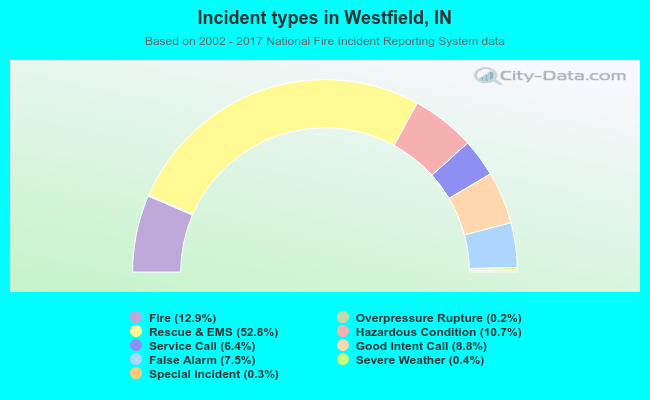 Out of all 8,152 cases reported during the years 2002 - 2017, the most belonged to the categories: Rescue & EMS (52.8%), Fire (12.9%), and Hazardous Condition (10.7%).
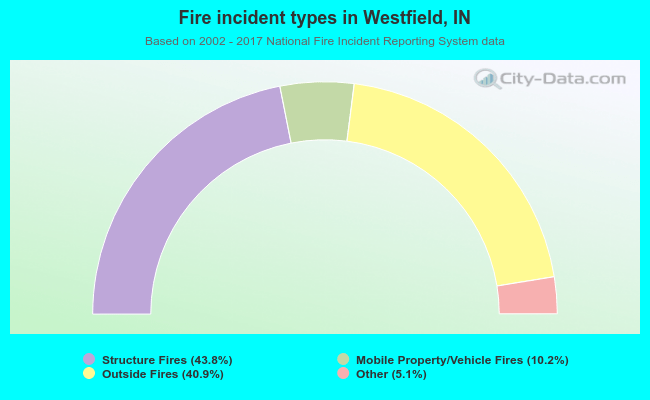 When looking into fire subcategories, the most incidents belonged to: Structure Fires (43.8%), and Outside Fires (40.9%).