Lawrence: Fire Incidents, Indiana (IN)
Where are fire incidents reported in Lawrence, IN
Something went wrong! Please refresh the page.
|
| |||||||||||||||||||||||||||||||||||||||||||||||||||||||||||||||||||||||||||||||||||||||||||||||||||||||||||||
2009 - 2018 National Fire Incident Reporting System (NFIRS) incidents
- Incident types reported to NFIRS in Lawrence, IN
- 7,59576.3%Rescue & EMS
- 7087.1%Good Intent Call
- 4945.0%Fire
- 4734.8%False Alarm
- 3743.8%Hazardous Condition
- 2522.5%Service Call
- 340.3%Special Incident
- 130.1%Overpressure Rupture
- Fire incident types reported to NFIRS in Lawrence, IN
- 21343.1%Structure Fires
- 17735.8%Outside Fires
- 8216.6%Mobile Property/Vehicle Fires
- 224.5%Other
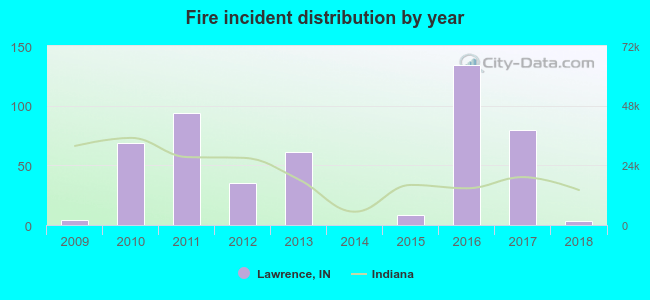 According to the data from the years 2009 - 2018 the average number of fire incidents per year is 49. The highest number of reported fires - 134 took place in 2016, and the least - 0 in 2014. The data has a dropping trend.
The average number of yearly fire incidents per 10k residents in Lawrence, IN compared to nearest cities:
(Note: Based on data for the last 3 years, including only cities with population 5,000 and above)
| Lawrence: | 15.2 |
| McCordsville: | 29.4 |
| Fishers: | 4.8 |
| Indianapolis: | 5.2 |
| Carmel: | 2.9 |
| Beech Grove: | 10.3 |
| Greenfield: | 36.8 |
| Noblesville: | 17.4 |
| Westfield: | 17.8 |
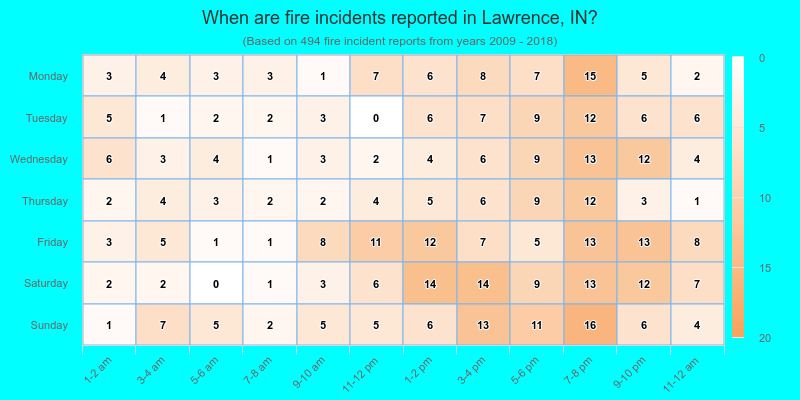
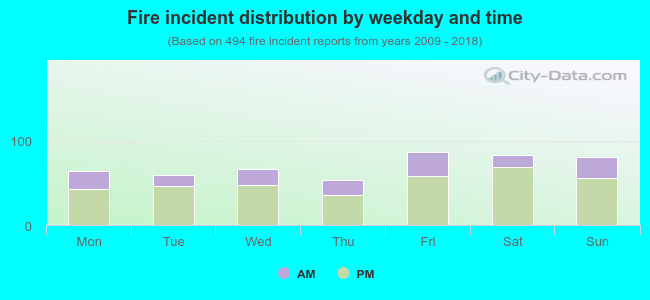 27.9% incidents where reported in the morning and 72.1% in the evening. The most fires (17.6%) took place on Friday, and the least (10.7%) on Thursday.
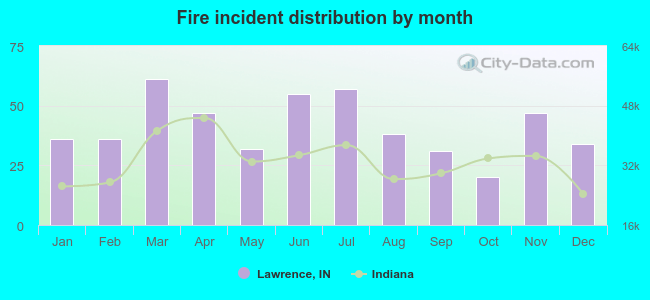 According to the 494 fire incident reports from years 2009 - 2018 most fires (12.3%) took place during March, and the least (4.0%) in October.
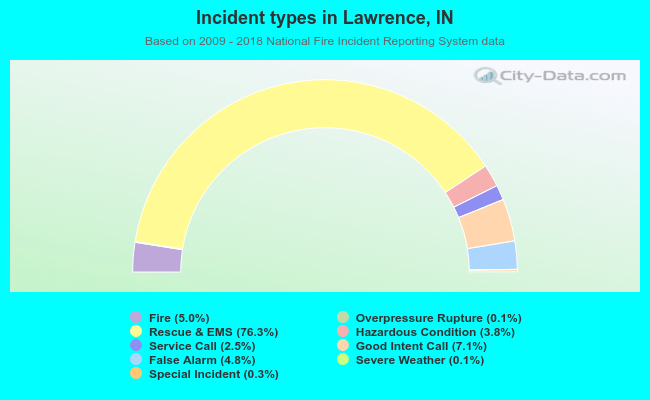 Out of all 9,949 cases reported during the years 2009 - 2018, the most belonged to the categories: Rescue & EMS (76.3%), Good Intent Call (7.1%), and Fire (5.0%).
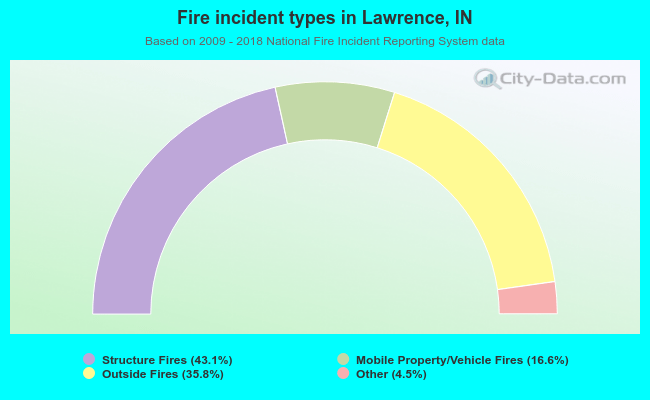 When looking into fire subcategories, the most reports belonged to: Structure Fires (43.1%), and Outside Fires (35.8%).