Grand Haven: Fire Incidents, Michigan (MI)
Where are fire incidents reported in Grand Haven, MI
Something went wrong! Please refresh the page.
| Fire incidents reported | |
|---|---|
| Sreet name | Count |
| 128TH AVE AVE | 80 |
| LAKESHORE DRIVE | 62 |
| 120TH AVE AVE | 60 |
| HAYES STREET | 54 |
| US-31 | 54 |
| 104TH AVE AVE | 50 |
| BEACON | 50 |
| MERCURY DRIVE | 48 |
| 112TH AVE AVE | 44 |
| WASHINGTON | 44 |
| BUCHANAN ST | 42 |
| NORTH CEDAR ST | 42 |
| HAYES ST | 40 |
| LAKESHORE DR | 38 |
| US31 | 38 |
| 168TH AVENUE | 36 |
| HAYES | 36 |
| JOHNSON ST | 36 |
| COMSTOCK STREET | 34 |
| ROBBINS | 34 |
| LINCOLN ST ST | 32 |
| ROBBINS ROAD | 32 |
| BUCHANAN STREET | 30 |
| 152ND AVENUE | 28 |
| ROBBINS RD | 28 |
| BEECHTREE | 26 |
| LAKE MICHIGAN DRIVE | 26 |
| SLEEPER ST | 26 |
| GREEN ST | 24 |
| LAKE MICHIGAN DRIVR/ M45 HWY | 24 |
| Other | 435 |
2002 - 2018 National Fire Incident Reporting System (NFIRS) incidents
- Incident types reported to NFIRS in Grand Haven, MI
- 6,66351.0%Rescue & EMS
- 1,63412.5%Good Intent Call
- 1,63312.5%Fire
- 1,2849.8%Hazardous Condition
- 1,0207.8%Service Call
- 7725.9%False Alarm
- 280.2%Severe Weather
- 170.1%Overpressure Rupture
- Fire incident types reported to NFIRS in Grand Haven, MI
- 73645.1%Structure Fires
- 53532.8%Outside Fires
- 25515.6%Mobile Property/Vehicle Fires
- 1076.6%Other
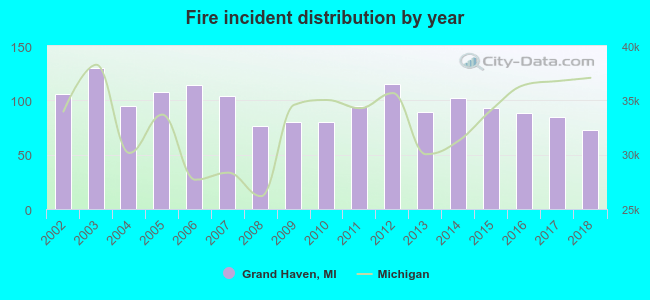 According to the data from the years 2002 - 2018 the average number of fire incidents per year is 96. The highest number of reported fire incidents - 130 took place in 2003, and the least - 73 in 2018. The data has a decreasing trend.
The average number of yearly fire incidents per 10k residents in Grand Haven, MI compared to nearest cities:
(Note: Based on data for the last 3 years, including only cities with population 5,000 and above)
| Grand Haven: | 74.8 |
| Norton Shores: | 37.9 |
| Muskegon Heights: | 78.7 |
| Muskegon: | 62.4 |
| Allendale: | 24.8 |
| Zeeland: | 75.2 |
| Holland: | 62.3 |
| Jenison: | 22.2 |
| Hudsonville: | 68.7 |
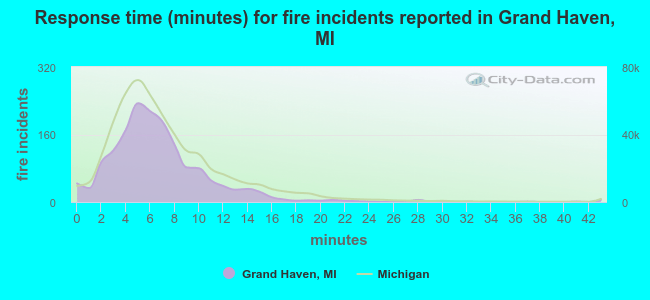 The median response time based on all reported fire incidents is 6 minutes. This is similar to the Michigan median value.
The median response time in Grand Haven, MI compared to nearest cities:
(Note: Based on data for all years, including only cities with at least 500 fire incidents)
| Grand Haven: | 6 minutes |
| Spring Lake: | 7 minutes |
| Norton Shores: | 5 minutes |
| Muskegon Heights: | 4 minutes |
| Muskegon: | 4 minutes |
| Coopersville: | 8 minutes |
| Allendale: | 8 minutes |
| Zeeland: | 7 minutes |
| Holland: | 6 minutes |
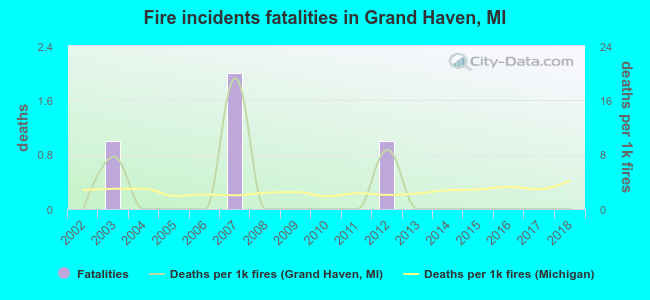 According to the reports from the years 2002 - 2018 the average number of fire-related fatalities per year is 0. The highest number of reported deaths - 2 took place in 2007, and the lowest - 0 in 2002. The data has a constant trend.
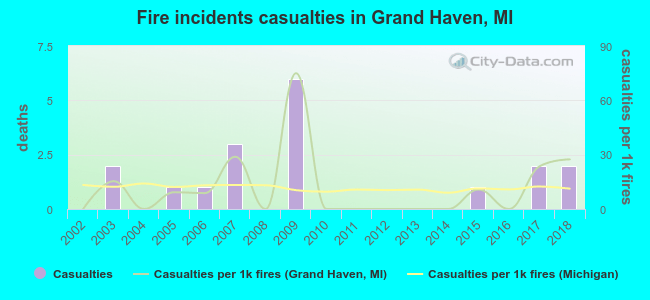 According to the reports from the years 2002 - 2018 the average number of fire-related casualties per year is 1. The highest number of reported casualties - 6 took place in 2009, and the lowest - 0 in 2002. The data has a growing trend.
The average number of casualties per 1,000 fires is 12. This indicator was the highest - 75 in 2009, and the lowest 0 in 2002. The trend for injuries per 1,000 incidents is rising. Compared to the state value the number of casualties per 1,000 fire incidents is about the same.
According to the reports from the years 2002 - 2018 the average number of fire-related casualties per year is 1. The highest number of reported casualties - 6 took place in 2009, and the lowest - 0 in 2002. The data has a growing trend.
The average number of casualties per 1,000 fires is 12. This indicator was the highest - 75 in 2009, and the lowest 0 in 2002. The trend for injuries per 1,000 incidents is rising. Compared to the state value the number of casualties per 1,000 fire incidents is about the same.Casualties per 1,000 incidents in Grand Haven, MI compared to nearest cities:
(Note: Based on data for all years, including only cities with at least 500 fire incidents)
| Grand Haven: | 11.0 |
| Spring Lake: | 1.6 |
| Norton Shores: | 7.1 |
| Muskegon Heights: | 6.6 |
| Muskegon: | 15.9 |
| Coopersville: | 0.0 |
| Allendale: | 4.6 |
| Zeeland: | 2.6 |
| Holland: | 14.7 |
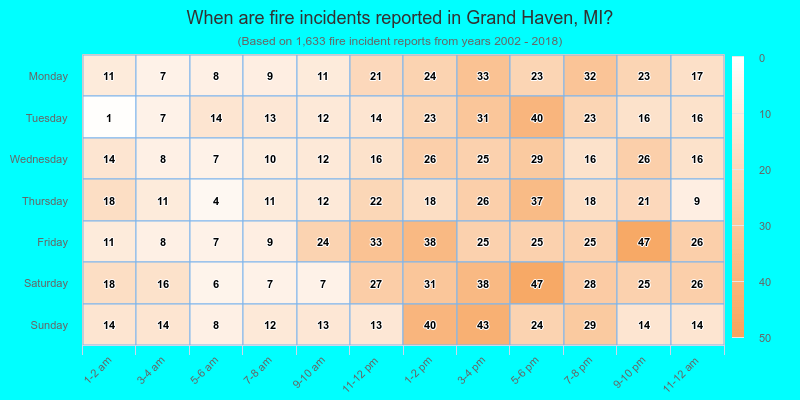
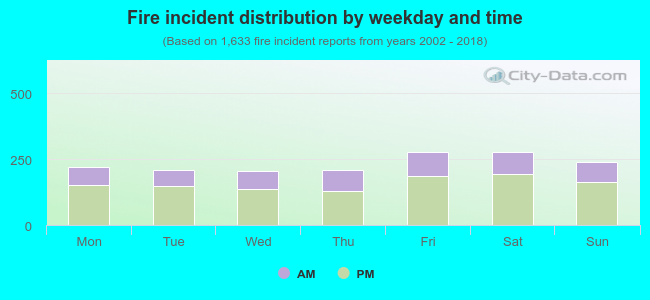 31.8% incidents where reported in the morning and 68.2% in the evening. The most fires (17.0%) took place on Friday, and the least (12.6%) on Wednesday.
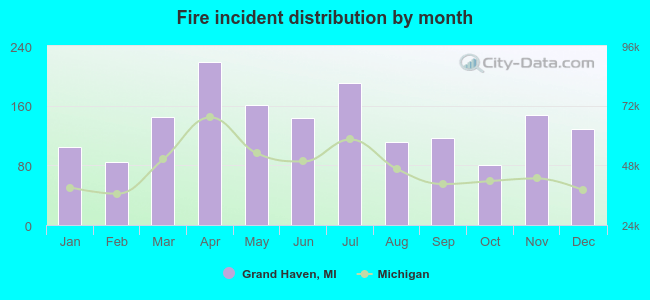 According to the 1,633 reports from years 2002 - 2018 most fires (13.3%) took place during April, and the least (5.0%) in October.
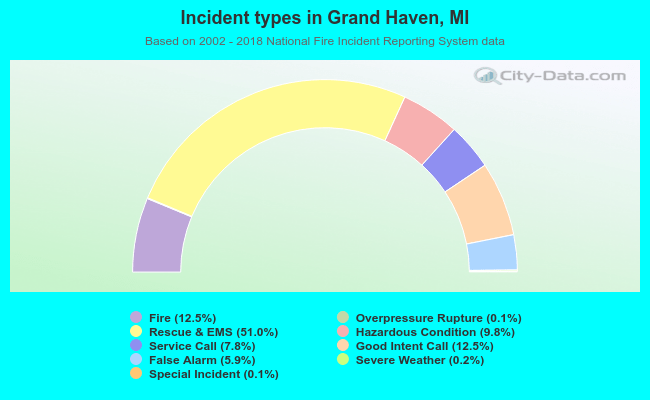 Out of all 13,063 cases reported during the years 2002 - 2018, the most belonged to the categories: Rescue & EMS (51.0%), Good Intent Call (12.5%), and Fire (12.5%).
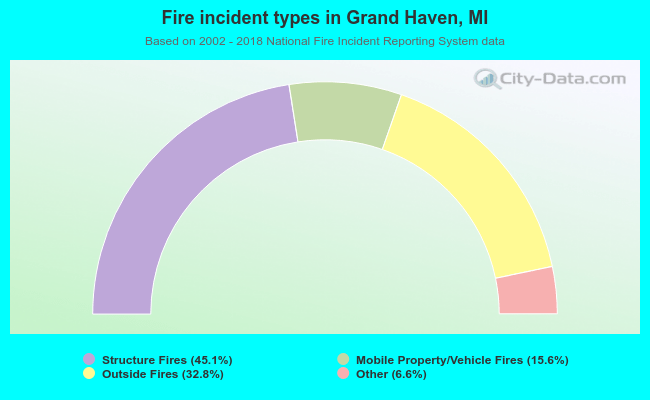 When looking into fire subcategories, the most reports belonged to: Structure Fires (45.1%), and Outside Fires (32.8%).