Holland: Fire Incidents, Michigan (MI)
Where are fire incidents reported in Holland, MI
Something went wrong! Please refresh the page.
| Fire incidents reported | |
|---|---|
| Sreet name | Count |
| 16TH ST | 178 |
| VAN OMMEN DR | 176 |
| 8TH ST | 114 |
| BUTTERNUT DR | 104 |
| 40TH ST | 100 |
| WASHINGTON AVE | 98 |
| LINCOLN AVE | 88 |
| 142ND AVE | 86 |
| 48TH ST | 76 |
| 17TH ST | 74 |
| I196 | 74 |
| 19TH ST | 72 |
| LAKEWOOD BLVD | 72 |
| 32ND ST | 66 |
| OTTAWA BEACH RD | 66 |
| RILEY ST | 64 |
| 136TH AVE | 62 |
| 24TH ST | 62 |
| 144TH AVE | 58 |
| JAMES ST | 58 |
| 18TH ST | 54 |
| 22ND ST | 54 |
| SOUTH SHORE DR | 54 |
| LAKESHORE DR | 52 |
| 120TH AVE | 50 |
| CHICAGO DR | 50 |
| NEW HOLLAND ST | 50 |
| 13TH ST | 46 |
| 60TH ST | 46 |
| QUINCY ST | 44 |
| Other | 949 |
2002 - 2018 National Fire Incident Reporting System (NFIRS) incidents
- Incident types reported to NFIRS in Holland, MI
- 13,77647.8%Rescue & EMS
- 4,19814.6%Hazardous Condition
- 3,19711.1%Fire
- 2,7449.5%Good Intent Call
- 2,4548.5%False Alarm
- 2,3328.1%Service Call
- 500.2%Overpressure Rupture
- 500.2%Special Incident
- Fire incident types reported to NFIRS in Holland, MI
- 1,58749.6%Structure Fires
- 85726.8%Outside Fires
- 58318.2%Mobile Property/Vehicle Fires
- 1705.3%Other
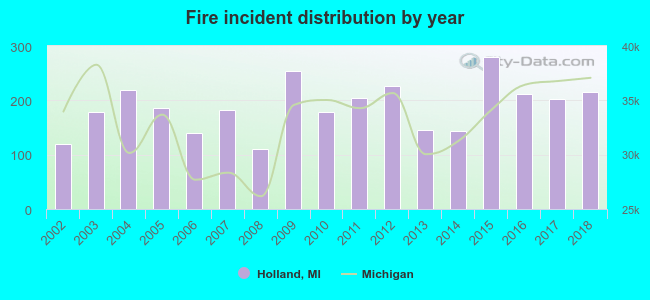 According to the data from the years 2002 - 2018 the average number of fire incidents per year is 188. The highest number of reported fire incidents - 279 took place in 2015, and the least - 111 in 2008. The data has a rising trend.
The average number of yearly fire incidents per 10k residents in Holland, MI compared to nearest cities:
(Note: Based on data for the last 3 years, including only cities with population 5,000 and above)
| Holland: | 62.3 |
| Zeeland: | 75.2 |
| Hudsonville: | 68.7 |
| Allendale: | 24.8 |
| Jenison: | 22.2 |
| Byron Center: | 108.8 |
| Grandville: | 32.4 |
| Grand Haven: | 74.8 |
| Allegan: | 153.8 |
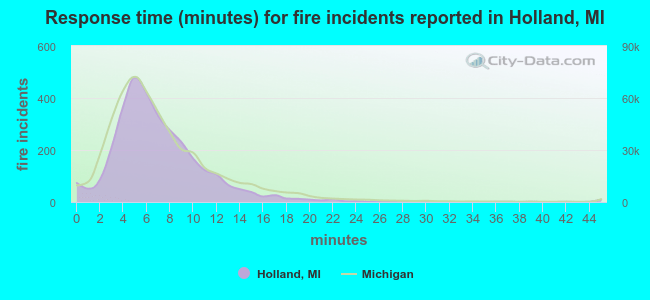 The median response time based on all reported fire incidents is 6 minutes. This is close to the Michigan median value.
The median response time in Holland, MI compared to nearest cities:
(Note: Based on data for all years, including only cities with at least 500 fire incidents)
| Holland: | 6 minutes |
| Zeeland: | 7 minutes |
| Fennville: | 7 minutes |
| Hudsonville: | 6 minutes |
| Allendale: | 8 minutes |
| Byron Center: | 8 minutes |
| Grandville: | 4 minutes |
| Grand Haven: | 6 minutes |
| Spring Lake: | 7 minutes |
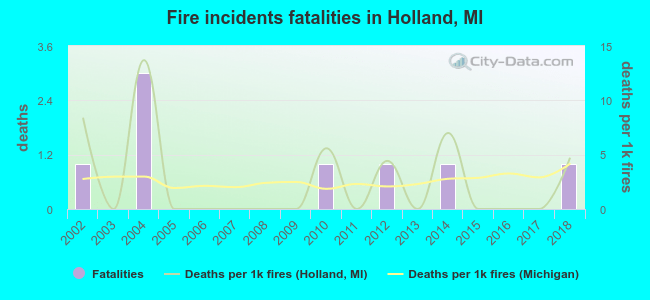 According to the reports from the years 2002 - 2018 the average number of fire-related yearly deaths is 0. The highest number of reported deaths - 3 took place in 2004, and the lowest - 0 in 2003. The data has a constant trend.
The average number of fatalities per 1,000 fire incidents is 3. This indicator was the highest - 14 in 2004, and the lowest 0 in 2003. The trend for deaths per 1,000 incidents is dropping. Compared to the state value the number of fatalities per 1,000 fire incidents is about the same.
According to the reports from the years 2002 - 2018 the average number of fire-related yearly deaths is 0. The highest number of reported deaths - 3 took place in 2004, and the lowest - 0 in 2003. The data has a constant trend.
The average number of fatalities per 1,000 fire incidents is 3. This indicator was the highest - 14 in 2004, and the lowest 0 in 2003. The trend for deaths per 1,000 incidents is dropping. Compared to the state value the number of fatalities per 1,000 fire incidents is about the same.Deaths per 1,000 incidents in Holland, MI compared to nearest cities:
(Note: Based on data for all years, including only cities with at least 2,500 fire incidents)
| Holland: | 2.5 |
| Wyoming: | 2.1 |
| Grand Rapids: | 2.1 |
| Muskegon: | 1.5 |
| Kalamazoo: | 4.6 |
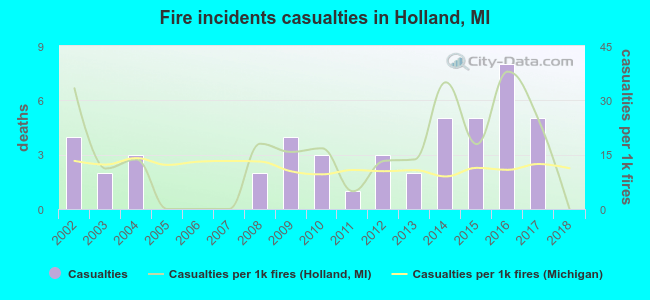 Based on the data from the years 2002 - 2018 the average number of fire-related yearly casualties is 3. The highest number of injuries - 8 took place in 2016, and the lowest - 0 in 2005. The data has a decreasing trend.
The average number of casualties per 1,000 fire incidents is 15. This indicator was the highest - 38 in 2016, and the lowest 0 in 2005. The trend for injuries per 1,000 incidents is decreasing. Compared to the Michigan value the number of casualties per 1,000 incidents is higher.
Based on the data from the years 2002 - 2018 the average number of fire-related yearly casualties is 3. The highest number of injuries - 8 took place in 2016, and the lowest - 0 in 2005. The data has a decreasing trend.
The average number of casualties per 1,000 fire incidents is 15. This indicator was the highest - 38 in 2016, and the lowest 0 in 2005. The trend for injuries per 1,000 incidents is decreasing. Compared to the Michigan value the number of casualties per 1,000 incidents is higher.Casualties per 1,000 incidents in Holland, MI compared to nearest cities:
(Note: Based on data for all years, including only cities with at least 500 fire incidents)
| Holland: | 14.7 |
| Zeeland: | 2.6 |
| Fennville: | 0.0 |
| Hudsonville: | 4.7 |
| Allendale: | 4.6 |
| Byron Center: | 0.0 |
| Grandville: | 28.7 |
| Grand Haven: | 11.0 |
| Spring Lake: | 1.6 |
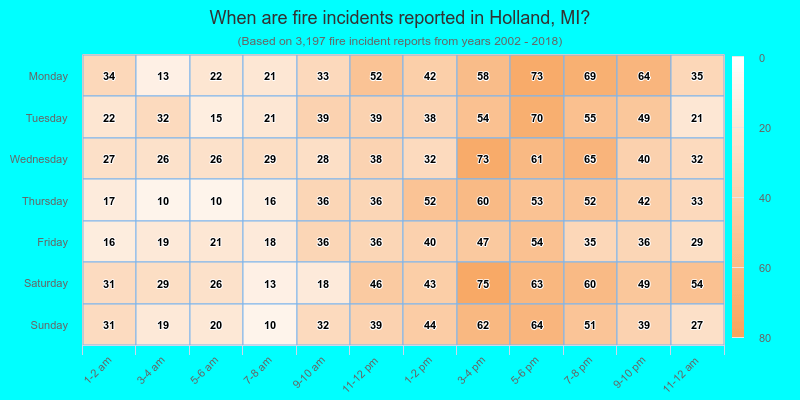
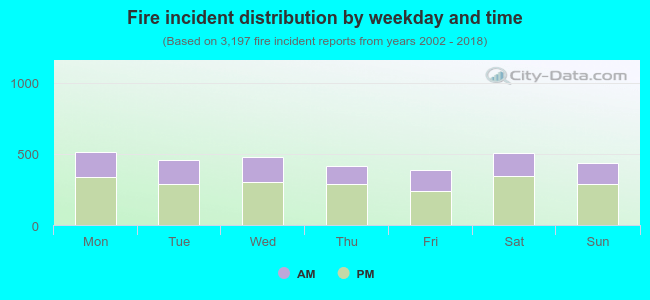 34.5% incidents where reported in the morning and 65.5% in the evening. The most fires (16.1%) took place on Monday, and the least (12.1%) on Friday.
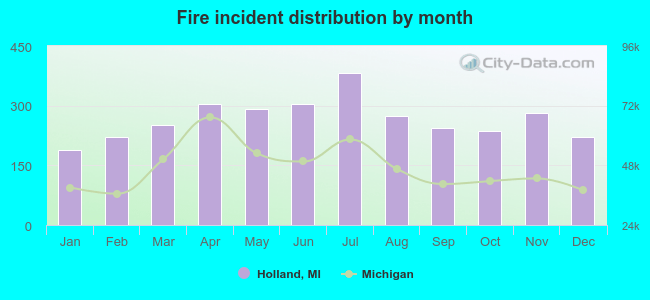 According to the 3,197 incident reports from years 2002 - 2018 most fires (11.9%) took place during July, and the least (5.9%) in January.
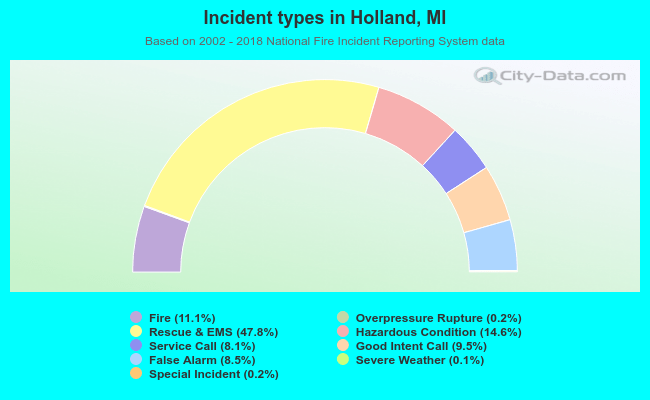 Out of all 28,816 cases reported during the years 2002 - 2018, the most belonged to the categories: Rescue & EMS (47.8%), Hazardous Condition (14.6%), and Fire (11.1%).
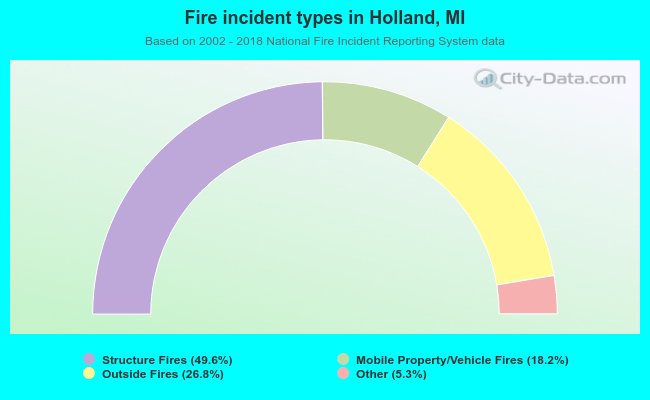 When looking into fire subcategories, the most reports belonged to: Structure Fires (49.6%), and Outside Fires (26.8%).