Norton Shores: Fire Incidents, Michigan (MI)
Where are fire incidents reported in Norton Shores, MI
Something went wrong! Please refresh the page.
| Fire incidents reported | |
|---|---|
| Sreet name | Count |
| GRAND HAVEN RD | 66 |
| GRAND HAVEN | 54 |
| HARVEY ST | 50 |
| HENRY ST | 50 |
| NORTON AV | 46 |
| STERNBERG RD | 44 |
| MT GARFIELD | 40 |
| NORTON | 40 |
| HENRY | 38 |
| HILE RD | 36 |
| SEMINOLE RD | 36 |
| BROADWAY | 34 |
| PONTALUNA | 32 |
| US31 | 32 |
| GETTY ST | 30 |
| HARVEY | 30 |
| STERNBERG | 30 |
| LINCOLN ST | 28 |
| PONTALUNA RD | 28 |
| PORTER RD | 28 |
| SEMINOLE | 26 |
| AIRPORT RD | 24 |
| HUIZENGA ST | 24 |
| BROADWAY AV | 22 |
| ELLIS | 22 |
| GETTY | 22 |
| LAKE FOREST LN | 22 |
| MCCRACKEN ST | 22 |
| AIRPORT | 20 |
| LAKE HARBOR RD | 20 |
| Other | 414 |
2002 - 2018 National Fire Incident Reporting System (NFIRS) incidents
- Incident types reported to NFIRS in Norton Shores, MI
- 7,37452.4%Rescue & EMS
- 2,07014.7%Hazardous Condition
- 1,42510.1%Service Call
- 1,41010.0%Fire
- 9967.1%Good Intent Call
- 7725.5%False Alarm
- 150.1%Overpressure Rupture
- Fire incident types reported to NFIRS in Norton Shores, MI
- 67347.7%Structure Fires
- 36225.7%Outside Fires
- 25518.1%Mobile Property/Vehicle Fires
- 1208.5%Other
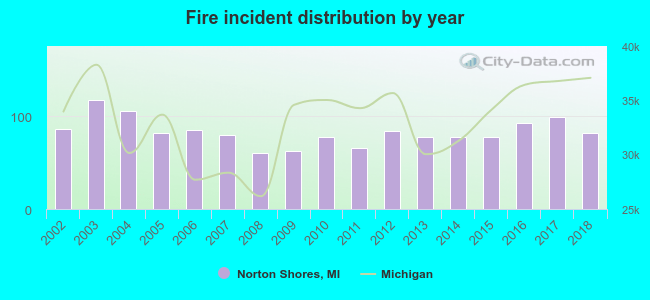 According to the data from the years 2002 - 2018 the average number of fires per year is 83. The highest number of fire incidents - 117 took place in 2003, and the least - 60 in 2008. The data has a decreasing trend.
The average number of yearly fire incidents per 10k residents in Norton Shores, MI compared to nearest cities:
(Note: Based on data for the last 3 years, including only cities with population 5,000 and above)
| Norton Shores: | 37.9 |
| Muskegon Heights: | 78.7 |
| Muskegon: | 62.4 |
| Grand Haven: | 74.8 |
| Allendale: | 24.8 |
| Zeeland: | 75.2 |
| Jenison: | 22.2 |
| Holland: | 62.3 |
| Walker: | 31.9 |
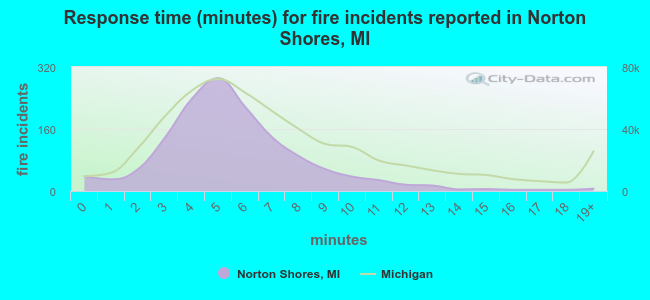 The median response time based on all reported fire incidents is 5 minutes. This is lower than the state median value.
The median response time in Norton Shores, MI compared to nearest cities:
(Note: Based on data for all years, including only cities with at least 500 fire incidents)
| Norton Shores: | 5 minutes |
| Muskegon Heights: | 4 minutes |
| Muskegon: | 4 minutes |
| Spring Lake: | 7 minutes |
| Grand Haven: | 6 minutes |
| Twin Lake: | 10 minutes |
| Whitehall: | 9 minutes |
| Coopersville: | 8 minutes |
| Allendale: | 8 minutes |
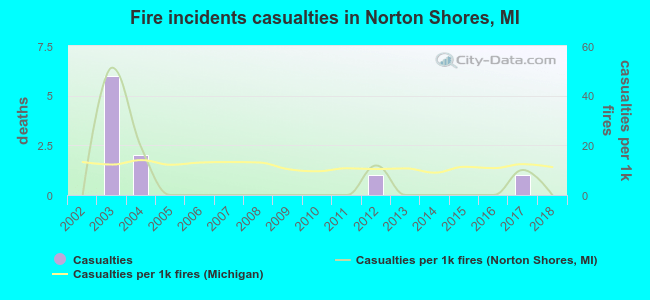 Based on the reports from the years 2002 - 2018 the average number of fire-related yearly casualties is 1. The highest number of reported injuries - 6 took place in 2003, and the lowest - 0 in 2002. The data has a constant trend.
The average number of injuries per 1,000 fires is 5. This indicator was the highest - 51 in 2003, and the lowest 0 in 2002. The trend for casualties per 1,000 fire incidents is constant. Compared to the Michigan value the number of injuries per 1,000 fires is lower.
Based on the reports from the years 2002 - 2018 the average number of fire-related yearly casualties is 1. The highest number of reported injuries - 6 took place in 2003, and the lowest - 0 in 2002. The data has a constant trend.
The average number of injuries per 1,000 fires is 5. This indicator was the highest - 51 in 2003, and the lowest 0 in 2002. The trend for casualties per 1,000 fire incidents is constant. Compared to the Michigan value the number of injuries per 1,000 fires is lower.Casualties per 1,000 incidents in Norton Shores, MI compared to nearest cities:
(Note: Based on data for all years, including only cities with at least 500 fire incidents)
| Norton Shores: | 7.1 |
| Muskegon Heights: | 6.6 |
| Muskegon: | 15.9 |
| Spring Lake: | 1.6 |
| Grand Haven: | 11.0 |
| Twin Lake: | 1.5 |
| Whitehall: | 0.0 |
| Coopersville: | 0.0 |
| Allendale: | 4.6 |
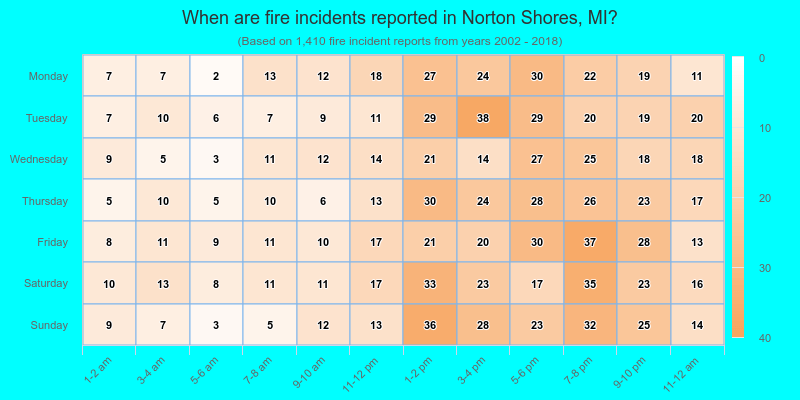
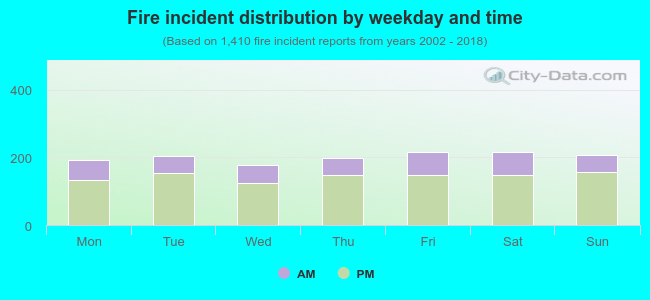 28.2% incidents where reported in the morning and 71.8% in the evening. The most fires (15.4%) took place on Saturday, and the least (12.6%) on Wednesday.
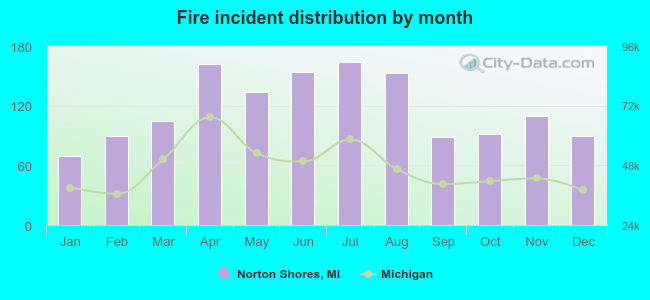 According to the 1,410 fires from years 2002 - 2018 most fires (11.6%) took place during July, and the least (4.9%) in January.
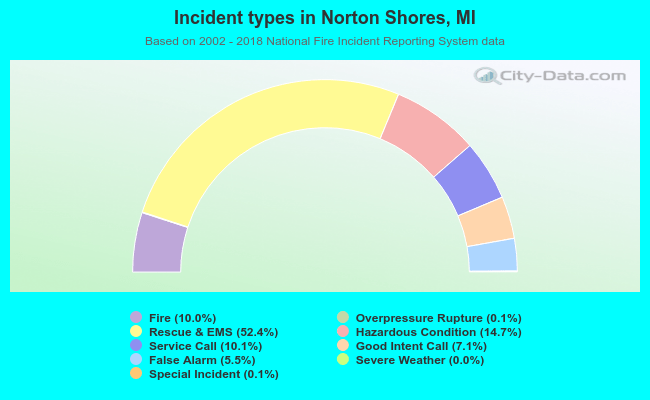 Out of all 14,081 cases reported during the years 2002 - 2018, the most belonged to the categories: Rescue & EMS (52.4%), Hazardous Condition (14.7%), and Service Call (10.1%).
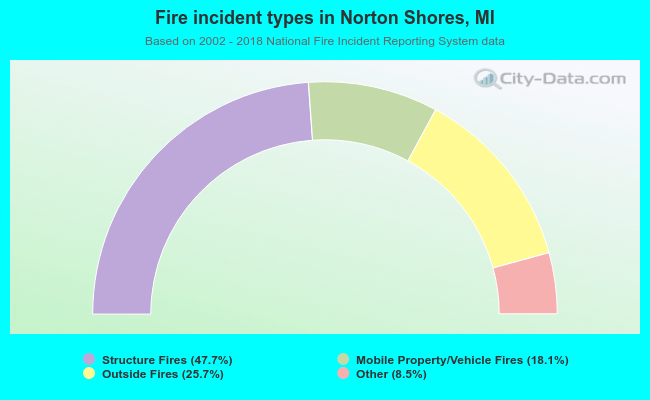 When looking into fire subcategories, the most incidents belonged to: Structure Fires (47.7%), and Outside Fires (25.7%).