Muskegon: Fire Incidents, Michigan (MI)
Where are fire incidents reported in Muskegon, MI
Something went wrong! Please refresh the page.
| Fire incidents reported | |
|---|---|
| Sreet name | Count |
| TERRACE ST | 642 |
| SHONAT ST | 308 |
| APPLE AVE | 284 |
| GETTY ST | 126 |
| SPRING ST | 126 |
| EVANSTON AVE | 106 |
| APPLE AV | 100 |
| LAKETON AVE | 96 |
| LAKESHORE DR | 90 |
| HARVEY ST | 84 |
| SHERIDAN DR | 84 |
| HOUSTON AV | 78 |
| HOLTON RD | 74 |
| SANFORD ST | 68 |
| JEFFERSON ST | 66 |
| LAKETON AV | 66 |
| HALL RD | 64 |
| WESTERN AV | 64 |
| WOOD ST | 64 |
| BROOKS RD | 62 |
| GLEN OAKS DR | 62 |
| SHERMAN | 62 |
| WHITE RD | 60 |
| APPLE | 56 |
| FOREST AVE | 56 |
| WHITEHALL RD | 56 |
| HOYT ST | 54 |
| PECK ST | 54 |
| MILL IRON RD | 52 |
| PINE ST | 52 |
| Other | 2,061 |
2002 - 2018 National Fire Incident Reporting System (NFIRS) incidents
- Incident types reported to NFIRS in Muskegon, MI
- 21,59253.6%Rescue & EMS
- 5,37913.3%Hazardous Condition
- 5,27713.1%Fire
- 3,3348.3%Good Intent Call
- 2,8637.1%Service Call
- 1,7124.2%False Alarm
- 730.2%Special Incident
- 580.1%Overpressure Rupture
- Fire incident types reported to NFIRS in Muskegon, MI
- 3,11159.0%Structure Fires
- 1,16222.0%Outside Fires
- 87416.6%Mobile Property/Vehicle Fires
- 1302.5%Other
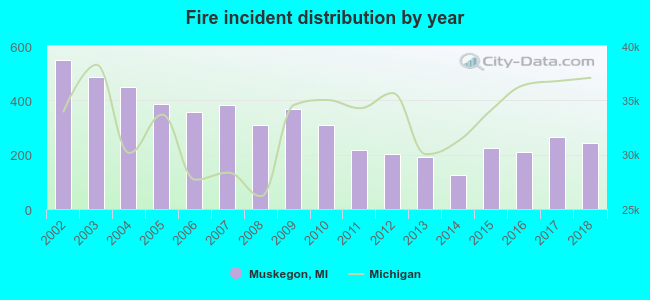 According to the data from the years 2002 - 2018 the average number of fires per year is 310. The highest number of fire incidents - 547 took place in 2002, and the least - 126 in 2014. The data has a dropping trend.
The average number of yearly fire incidents per 10k residents in Muskegon, MI compared to nearest cities:
(Note: Based on data for the last 3 years, including only cities with population 5,000 and above)
| Muskegon: | 62.4 |
| Muskegon Heights: | 78.7 |
| Norton Shores: | 37.9 |
| Grand Haven: | 74.8 |
| Allendale: | 24.8 |
| Walker: | 31.9 |
| Jenison: | 22.2 |
| Zeeland: | 75.2 |
| Comstock Park: | 62.8 |
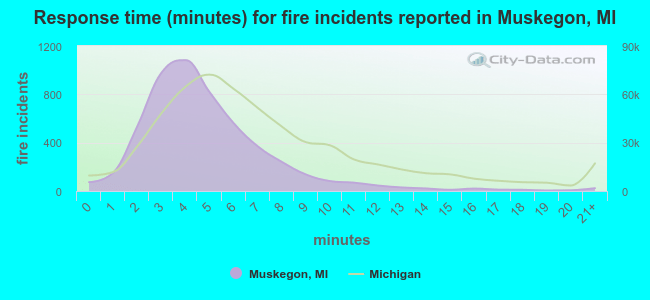 The median response time based on all reported fire incidents is 4 minutes. This is lower compared to the state median value.
The median response time in Muskegon, MI compared to nearest cities:
(Note: Based on data for all years, including only cities with at least 500 fire incidents)
| Muskegon: | 4 minutes |
| Muskegon Heights: | 4 minutes |
| Norton Shores: | 5 minutes |
| Twin Lake: | 10 minutes |
| Spring Lake: | 7 minutes |
| Grand Haven: | 6 minutes |
| Whitehall: | 9 minutes |
| Coopersville: | 8 minutes |
| Fremont: | 9 minutes |
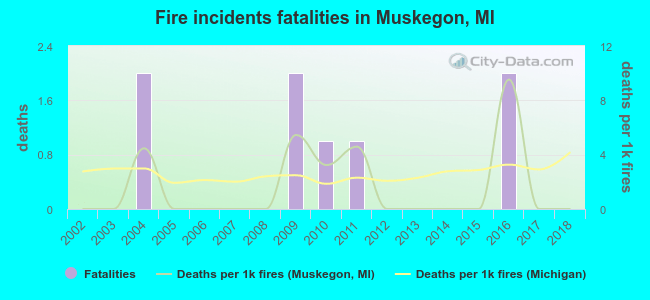 Based on the reports from the years 2002 - 2018 the average number of fire-related fatalities per year is 0. The highest number of reported deaths - 2 took place in 2004, and the lowest - 0 in 2002. The data has a constant trend.
The average number of fatalities per 1,000 fire incidents is 2. This indicator was the highest - 10 in 2016, and the lowest 0 in 2002. The trend for deaths per 1,000 fires is constant. Compared to the state value the number of fatalities per 1,000 incidents is lower.
Based on the reports from the years 2002 - 2018 the average number of fire-related fatalities per year is 0. The highest number of reported deaths - 2 took place in 2004, and the lowest - 0 in 2002. The data has a constant trend.
The average number of fatalities per 1,000 fire incidents is 2. This indicator was the highest - 10 in 2016, and the lowest 0 in 2002. The trend for deaths per 1,000 fires is constant. Compared to the state value the number of fatalities per 1,000 incidents is lower.Deaths per 1,000 incidents in Muskegon, MI compared to nearest cities:
(Note: Based on data for all years, including only cities with at least 2,500 fire incidents)
| Muskegon: | 1.5 |
| Holland: | 2.5 |
| Grand Rapids: | 2.1 |
| Wyoming: | 2.1 |
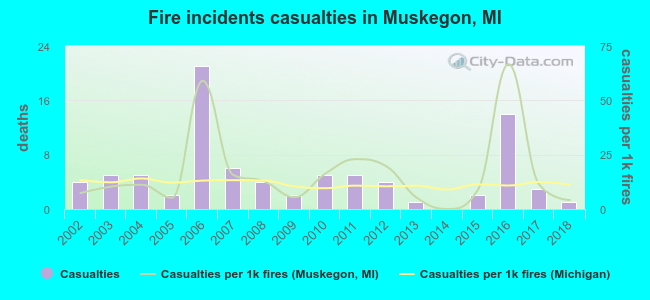 Based on the data from the years 2002 - 2018 the average number of fire-related yearly casualties is 5. The highest number of reported casualties - 21 took place in 2006, and the lowest - 0 in 2014. The data has a declining trend.
The average number of casualties per 1,000 fire incidents is 17. This indicator was the highest - 67 in 2016, and the lowest 0 in 2014. The trend for casualties per 1,000 fires is dropping. Compared to the Michigan value the number of injuries per 1,000 fires is higher.
Based on the data from the years 2002 - 2018 the average number of fire-related yearly casualties is 5. The highest number of reported casualties - 21 took place in 2006, and the lowest - 0 in 2014. The data has a declining trend.
The average number of casualties per 1,000 fire incidents is 17. This indicator was the highest - 67 in 2016, and the lowest 0 in 2014. The trend for casualties per 1,000 fires is dropping. Compared to the Michigan value the number of injuries per 1,000 fires is higher.Casualties per 1,000 incidents in Muskegon, MI compared to nearest cities:
(Note: Based on data for all years, including only cities with at least 500 fire incidents)
| Muskegon: | 15.9 |
| Muskegon Heights: | 6.6 |
| Norton Shores: | 7.1 |
| Twin Lake: | 1.5 |
| Spring Lake: | 1.6 |
| Grand Haven: | 11.0 |
| Whitehall: | 0.0 |
| Coopersville: | 0.0 |
| Fremont: | 1.5 |
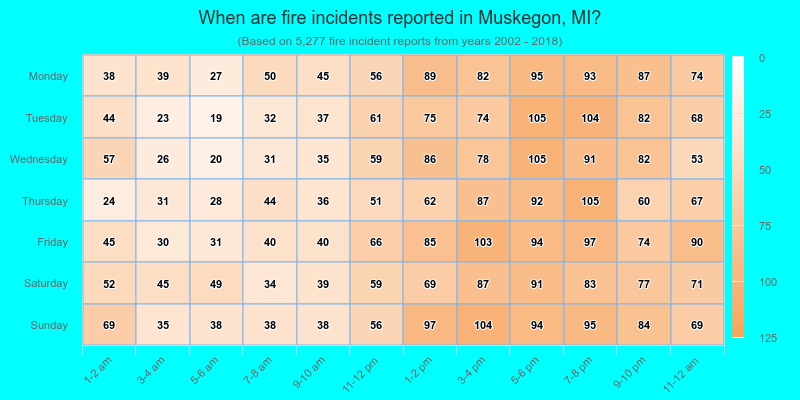
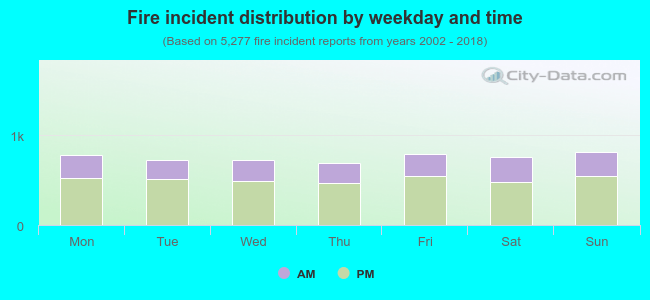 32.5% incidents where reported in the morning and 67.5% in the evening. The most fires (15.5%) took place on Sunday, and the least (13.0%) on Thursday.
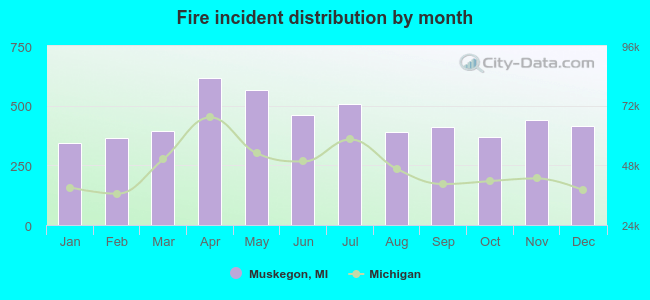 Based on the 5,277 incident reports from years 2002 - 2018 most fires (11.7%) took place during April, and the least (6.5%) in January.
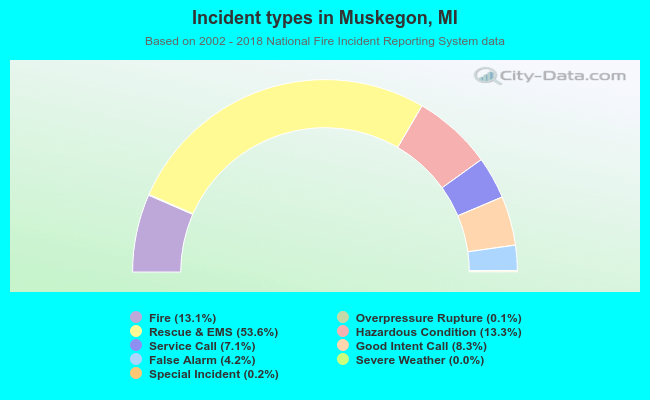 Out of all 40,298 cases reported during the years 2002 - 2018, the most belonged to the categories: Rescue & EMS (53.6%), Hazardous Condition (13.3%), and Fire (13.1%).
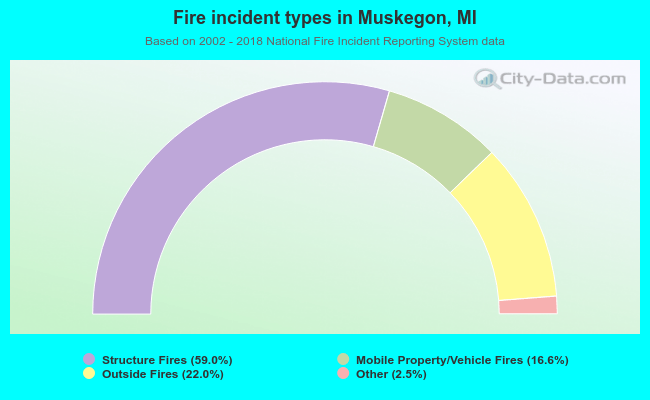 When looking into fire subcategories, the most incidents belonged to: Structure Fires (59.0%), and Outside Fires (22.0%).