Grandville: Fire Incidents, Michigan (MI)
Where are fire incidents reported in Grandville, MI
Something went wrong! Please refresh the page.
| Fire incidents reported | |
|---|---|
| Sreet name | Count |
| CHICAGO DR | 104 |
| WILSON AVE | 82 |
| 28TH ST | 70 |
| KENOWA | 70 |
| RIVERTOWN PKY | 64 |
| CANAL | 60 |
| IVANREST | 52 |
| 44TH ST | 48 |
| WIMBLEDON | 44 |
| PRAIRIE | 32 |
| CENTURY CENTER | 24 |
| 30TH ST | 22 |
| RIVERTOWN POINTE CT | 20 |
| KENOWA AVE | 18 |
| PINE CREEK | 18 |
| SPARTAN INDUSTRIAL | 18 |
| BUSCH | 16 |
| FERRY | 16 |
| VIADUCT | 16 |
| GENESIS CT | 14 |
| HERITAGE CT | 14 |
| 8TH AVE | 12 |
| BLACKFOOT | 12 |
| VIADUCT ST | 12 |
| 40TH ST | 10 |
| 41ST ST | 10 |
| BLACKHAWK | 10 |
| BROOKSIDE | 10 |
| CHEYENNE | 10 |
| GABLE | 10 |
2002 - 2018 National Fire Incident Reporting System (NFIRS) incidents
- Incident types reported to NFIRS in Grandville, MI
- 7,72558.0%Rescue & EMS
- 1,60812.1%Hazardous Condition
- 1,2379.3%Service Call
- 1,0497.9%Good Intent Call
- 9076.8%Fire
- 7735.8%False Alarm
- 150.1%Special Incident
- Fire incident types reported to NFIRS in Grandville, MI
- 39743.8%Structure Fires
- 24426.9%Outside Fires
- 23826.2%Mobile Property/Vehicle Fires
- 283.1%Other
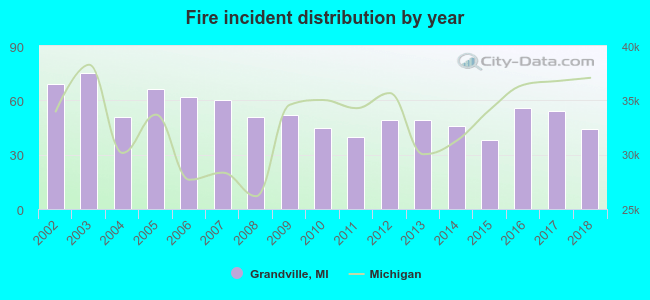 Based on the data from the years 2002 - 2018 the average number of fires per year is 53. The highest number of fire incidents - 75 took place in 2003, and the least - 38 in 2015. The data has a dropping trend.
The average number of yearly fire incidents per 10k residents in Grandville, MI compared to nearest cities:
(Note: Based on data for the last 3 years, including only cities with population 5,000 and above)
| Grandville: | 32.4 |
| Wyoming: | 27.7 |
| Jenison: | 22.2 |
| Hudsonville: | 68.7 |
| Grand Rapids: | 42.6 |
| Cutlerville: | 4.9 |
| Byron Center: | 108.8 |
| Walker: | 31.9 |
| Kentwood: | 22.3 |
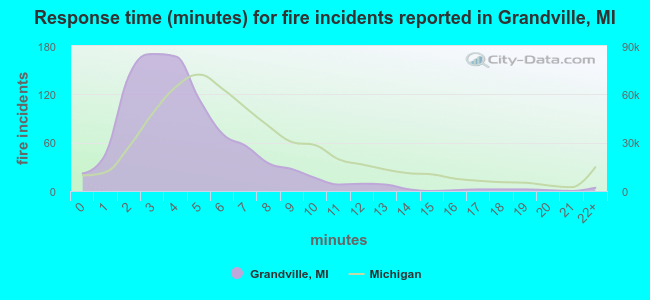 The median response time based on all reported fire incidents is 4 minutes. This is lower compared to the state median value.
The median response time in Grandville, MI compared to nearest cities:
(Note: Based on data for all years, including only cities with at least 500 fire incidents)
| Grandville: | 4 minutes |
| Wyoming: | 6 minutes |
| Hudsonville: | 6 minutes |
| Grand Rapids: | 5 minutes |
| Byron Center: | 8 minutes |
| Walker: | 9 minutes |
| Kentwood: | 5 minutes |
| Comstock Park: | 7 minutes |
| Allendale: | 8 minutes |
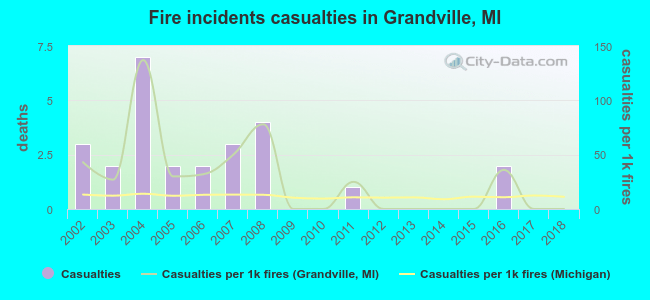 According to the reports from the years 2002 - 2018 the average number of fire-related casualties per year is 2. The highest number of reported casualties - 7 took place in 2004, and the lowest - 0 in 2009. The data has a dropping trend.
The average number of injuries per 1,000 fire incidents is 27. This indicator was the highest - 137 in 2004, and the lowest 0 in 2009. The trend for injuries per 1,000 fires is dropping. Compared to the Michigan value the number of injuries per 1,000 incidents is much higher.
According to the reports from the years 2002 - 2018 the average number of fire-related casualties per year is 2. The highest number of reported casualties - 7 took place in 2004, and the lowest - 0 in 2009. The data has a dropping trend.
The average number of injuries per 1,000 fire incidents is 27. This indicator was the highest - 137 in 2004, and the lowest 0 in 2009. The trend for injuries per 1,000 fires is dropping. Compared to the Michigan value the number of injuries per 1,000 incidents is much higher.Casualties per 1,000 incidents in Grandville, MI compared to nearest cities:
(Note: Based on data for all years, including only cities with at least 500 fire incidents)
| Grandville: | 28.7 |
| Wyoming: | 36.2 |
| Hudsonville: | 4.7 |
| Grand Rapids: | 15.0 |
| Byron Center: | 0.0 |
| Walker: | 8.7 |
| Kentwood: | 34.5 |
| Comstock Park: | 15.0 |
| Allendale: | 4.6 |
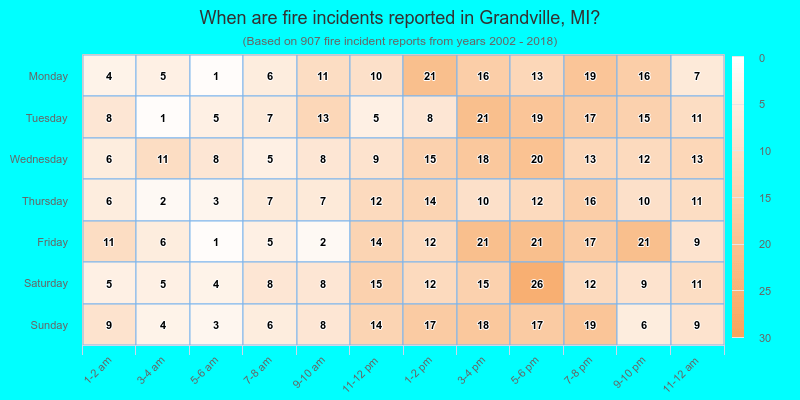
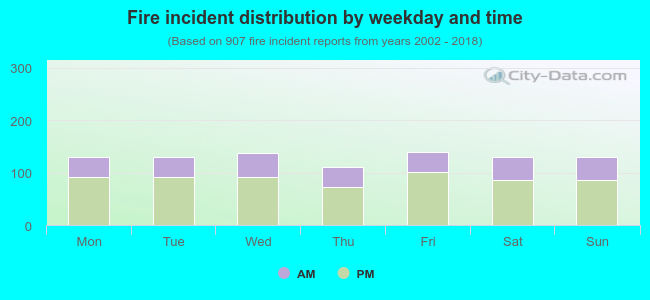 31.8% incidents where reported in the morning and 68.2% in the evening. The most fires (15.4%) took place on Friday, and the least (12.1%) on Thursday.
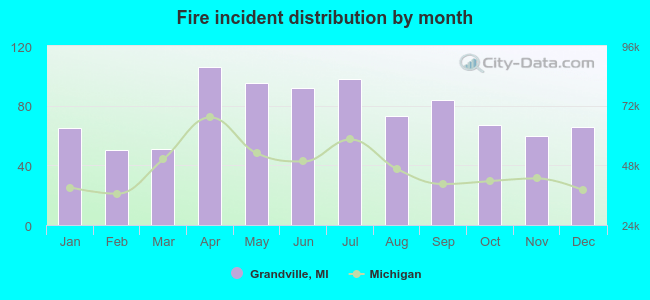 According to the 907 incident reports from years 2002 - 2018 most fires (11.7%) took place during April, and the least (5.5%) in February.
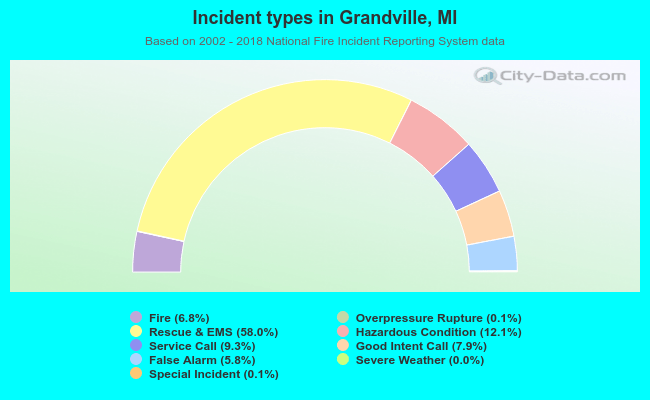 Out of all 13,328 cases reported during the years 2002 - 2018, the most belonged to the categories: Rescue & EMS (58.0%), Hazardous Condition (12.1%), and Service Call (9.3%).
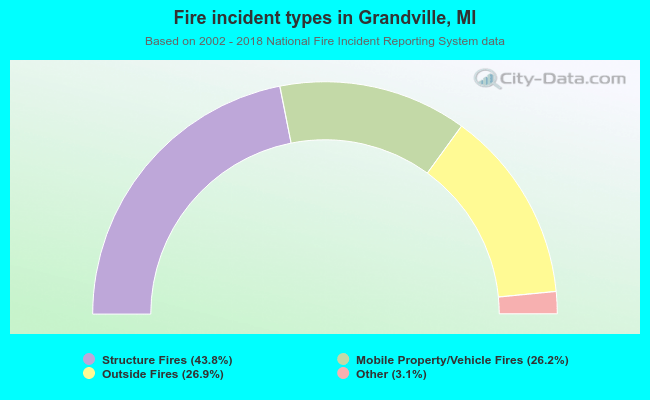 When looking into fire subcategories, the most reports belonged to: Structure Fires (43.8%), and Outside Fires (26.9%).