Kentwood: Fire Incidents, Michigan (MI)
Where are fire incidents reported in Kentwood, MI
Something went wrong! Please refresh the page.
| Fire incidents reported | |
|---|---|
| Sreet name | Count |
| 28TH ST | 110 |
| 28TH ST | 104 |
| 44TH ST | 82 |
| 52ND ST | 82 |
| 52ND ST | 82 |
| 44TH ST | 78 |
| BRETON AVE | 72 |
| BROADMOOR AVE | 68 |
| BROADMOOR AVE | 56 |
| DIVISION AVE | 56 |
| BRETON AVE | 52 |
| DIVISION AVE | 48 |
| 60TH ST | 44 |
| EASTERN AVE | 40 |
| KALAMAZOO AVE | 40 |
| 60TH ST | 38 |
| EASTERN AVE | 38 |
| BRETON CT | 30 |
| CREEK DR | 30 |
| CREEK DR | 30 |
| EAST PARIS AVE | 30 |
| KALAMAZOO AVE | 30 |
| 36TH ST | 28 |
| PHEASANT RIDGE DR | 26 |
| 56TH ST | 24 |
| EAST PARIS AVE | 24 |
| 29TH ST | 22 |
| 48TH ST | 22 |
| DRUMMOND BLVD | 22 |
| NATURE TRAIL DR | 20 |
| Other | 544 |
2002 - 2018 National Fire Incident Reporting System (NFIRS) incidents
- Incident types reported to NFIRS in Kentwood, MI
- 17,19362.2%Rescue & EMS
- 2,5329.2%Hazardous Condition
- 2,4388.8%Good Intent Call
- 1,9727.1%Fire
- 1,8976.9%False Alarm
- 1,5405.6%Service Call
- 290.1%Overpressure Rupture
- Fire incident types reported to NFIRS in Kentwood, MI
- 98950.2%Structure Fires
- 55428.1%Outside Fires
- 39720.1%Mobile Property/Vehicle Fires
- 321.6%Other
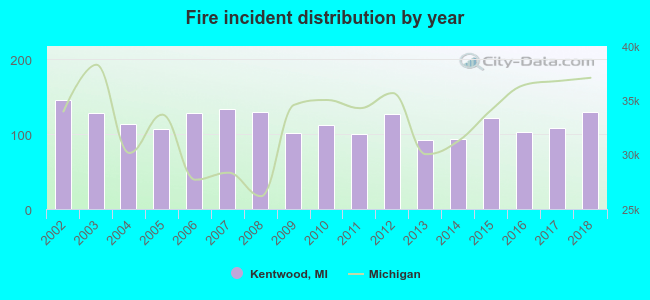 According to the data from the years 2002 - 2018 the average number of fire incidents per year is 116. The highest number of fire incidents - 145 took place in 2002, and the least - 92 in 2013. The data has a declining trend.
The average number of yearly fire incidents per 10k residents in Kentwood, MI compared to nearest cities:
(Note: Based on data for the last 3 years, including only cities with population 5,000 and above)
| Kentwood: | 22.3 |
| Cutlerville: | 4.9 |
| East Grand Rapids: | 6.8 |
| Wyoming: | 27.7 |
| Grand Rapids: | 42.6 |
| Grandville: | 32.4 |
| Byron Center: | 108.8 |
| Walker: | 31.9 |
| Jenison: | 22.2 |
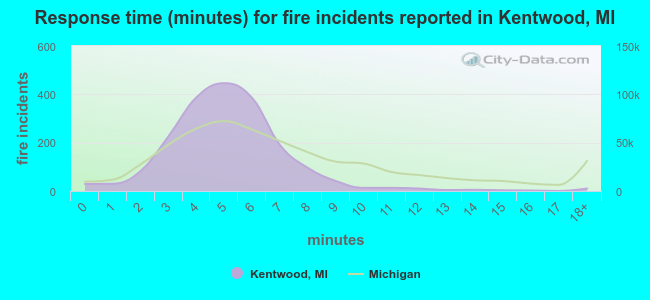 The median response time based on all reported fire incidents is 5 minutes. This is lower than the Michigan median value.
The median response time in Kentwood, MI compared to nearest cities:
(Note: Based on data for all years, including only cities with at least 500 fire incidents)
| Kentwood: | 5 minutes |
| Wyoming: | 6 minutes |
| Grand Rapids: | 5 minutes |
| Grandville: | 4 minutes |
| Byron Center: | 8 minutes |
| Caledonia: | 8 minutes |
| Walker: | 9 minutes |
| Comstock Park: | 7 minutes |
| Hudsonville: | 6 minutes |
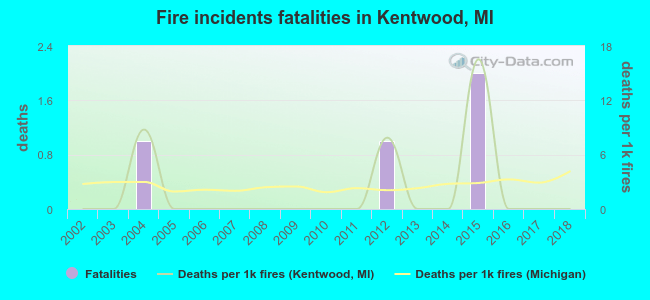 According to the data from the years 2002 - 2018 the average number of fire-related yearly deaths is 0. The highest number of reported deaths - 2 took place in 2015, and the lowest - 0 in 2002. The data has a constant trend.
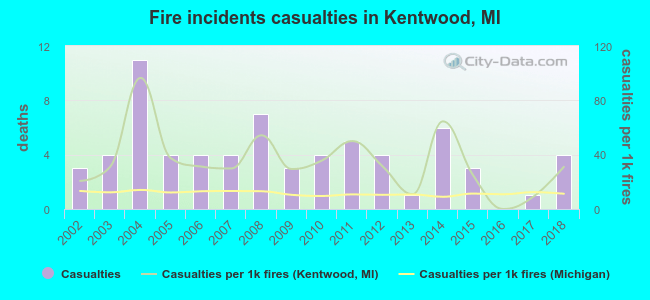 Based on the reports from the years 2002 - 2018 the average number of fire-related casualties per year is 4. The highest number of reported casualties - 11 took place in 2004, and the lowest - 0 in 2016. The data has a rising trend.
The average number of injuries per 1,000 fire incidents is 35. This indicator was the highest - 96 in 2004, and the lowest 0 in 2016. The trend for injuries per 1,000 fires is rising. Compared to the Michigan value the number of injuries per 1,000 fire incidents is much higher.
Based on the reports from the years 2002 - 2018 the average number of fire-related casualties per year is 4. The highest number of reported casualties - 11 took place in 2004, and the lowest - 0 in 2016. The data has a rising trend.
The average number of injuries per 1,000 fire incidents is 35. This indicator was the highest - 96 in 2004, and the lowest 0 in 2016. The trend for injuries per 1,000 fires is rising. Compared to the Michigan value the number of injuries per 1,000 fire incidents is much higher.Casualties per 1,000 incidents in Kentwood, MI compared to nearest cities:
(Note: Based on data for all years, including only cities with at least 500 fire incidents)
| Kentwood: | 34.5 |
| Wyoming: | 36.2 |
| Grand Rapids: | 15.0 |
| Grandville: | 28.7 |
| Byron Center: | 0.0 |
| Caledonia: | 7.0 |
| Walker: | 8.7 |
| Comstock Park: | 15.0 |
| Hudsonville: | 4.7 |
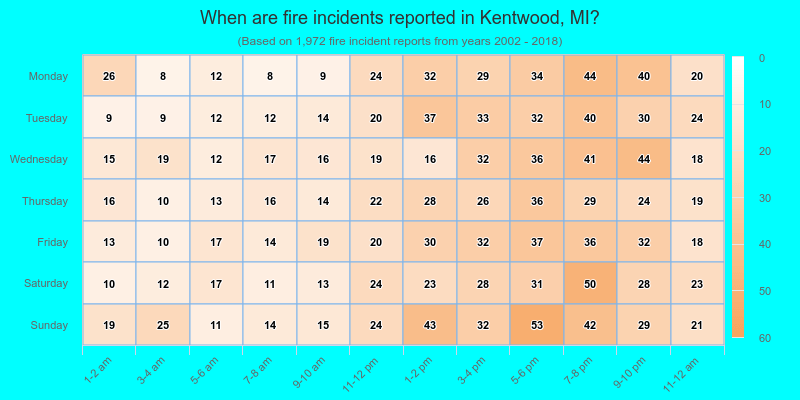
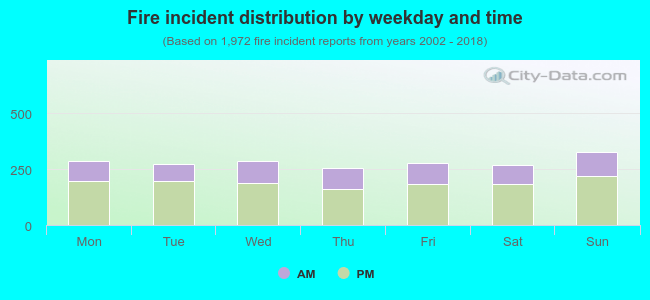 32.5% incidents where reported in the morning and 67.5% in the evening. The most fires (16.6%) took place on Sunday, and the least (12.8%) on Thursday.
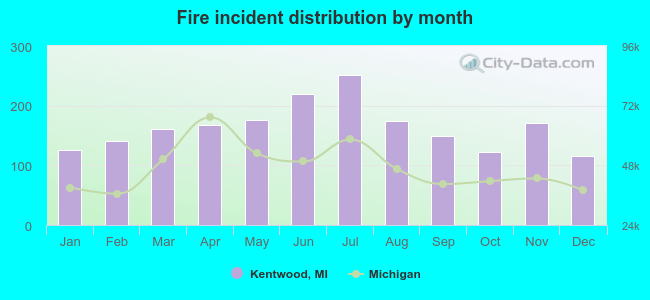 According to the 1,972 fire incidents from years 2002 - 2018 most fires (12.7%) took place during July, and the least (5.9%) in December.
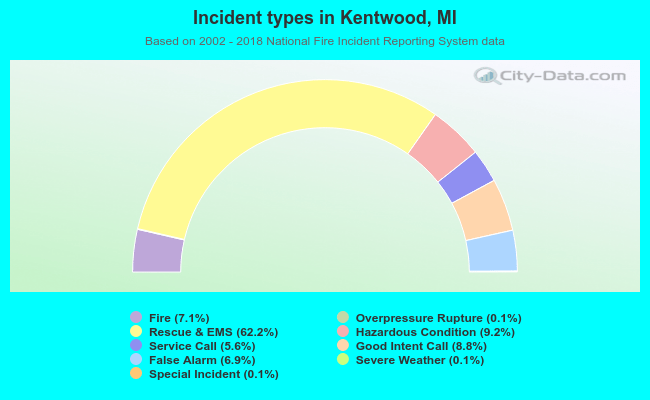 Out of all 27,633 cases reported during the years 2002 - 2018, the most belonged to the categories: Rescue & EMS (62.2%), Hazardous Condition (9.2%), and Good Intent Call (8.8%).
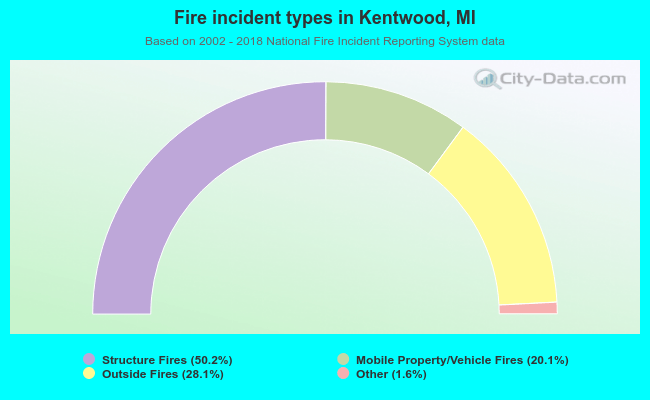 When looking into fire subcategories, the most incidents belonged to: Structure Fires (50.2%), and Outside Fires (28.1%).