Walker: Fire Incidents, Michigan (MI)
Where are fire incidents reported in Walker, MI
Something went wrong! Please refresh the page.
| Fire incidents reported | |
|---|---|
| Sreet name | Count |
| ALPINE AVE | 244 |
| WILSON AVE | 120 |
| 3 MILE RD | 102 |
| 4 MILE RD | 80 |
| LAKE MICHIGAN DR | 60 |
| TURNER AVE | 60 |
| CENTER DR | 42 |
| REMEMBRANCE RD | 40 |
| THREE MILE RD | 40 |
| WALKER AVE | 40 |
| LEONARD ST | 36 |
| PANNELL ST | 36 |
| MANZANA CT | 32 |
| FRUIT RIDGE AVE | 30 |
| BUTTERWORTH AVE | 26 |
| FOUR MILE RD | 26 |
| KINNEY AVE | 24 |
| MAYNARD AVE | 24 |
| RICHMOND ST | 22 |
| HARDING ST | 20 |
| MAPLEROW AVE | 20 |
| BRISTOL AVE | 18 |
| KENOWA AVE | 18 |
| PRESTON RIDGE | 18 |
| WALKENT DR | 18 |
| I96 EXPY | 16 |
| OBRIEN ST | 16 |
| PEACH RIDGE AVE | 16 |
| ROGER ST | 16 |
| WALDORF ST | 16 |
2002 - 2018 National Fire Incident Reporting System (NFIRS) incidents
- Incident types reported to NFIRS in Walker, MI
- 1,33125.1%Hazardous Condition
- 1,14821.7%Fire
- 91417.3%Good Intent Call
- 83715.8%Service Call
- 69713.2%False Alarm
- 3456.5%Rescue & EMS
- 90.2%Severe Weather
- 80.2%Overpressure Rupture
- Fire incident types reported to NFIRS in Walker, MI
- 49042.7%Structure Fires
- 34530.1%Mobile Property/Vehicle Fires
- 27223.7%Outside Fires
- 413.6%Other
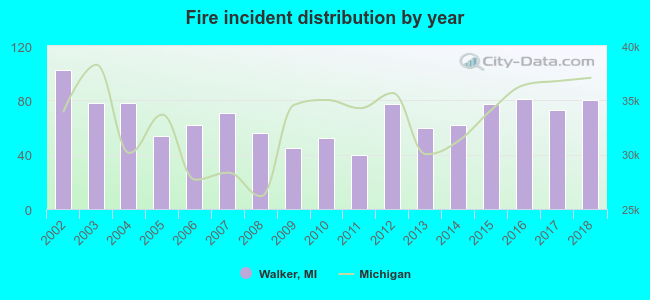 According to the data from the years 2002 - 2018 the average number of fire incidents per year is 68. The highest number of reported fire incidents - 102 took place in 2002, and the least - 40 in 2011. The data has a dropping trend.
The average number of yearly fire incidents per 10k residents in Walker, MI compared to nearest cities:
(Note: Based on data for the last 3 years, including only cities with population 5,000 and above)
| Walker: | 31.9 |
| Comstock Park: | 62.8 |
| Grand Rapids: | 42.6 |
| Grandville: | 32.4 |
| Wyoming: | 27.7 |
| East Grand Rapids: | 6.8 |
| Jenison: | 22.2 |
| Allendale: | 24.8 |
| Kentwood: | 22.3 |
 The median response time based on all reported fire incidents is 9 minutes. This is higher than the Michigan median value.
The median response time in Walker, MI compared to nearest cities:
(Note: Based on data for all years, including only cities with at least 500 fire incidents)
| Walker: | 9 minutes |
| Comstock Park: | 7 minutes |
| Grand Rapids: | 5 minutes |
| Grandville: | 4 minutes |
| Wyoming: | 6 minutes |
| Allendale: | 8 minutes |
| Kentwood: | 5 minutes |
| Coopersville: | 8 minutes |
| Sparta: | 7 minutes |
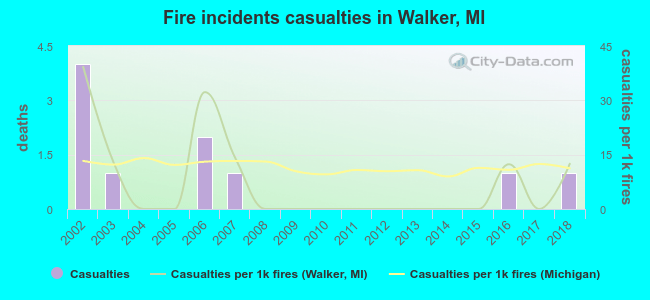 Based on the data from the years 2002 - 2018 the average number of fire-related casualties per year is 1. The highest number of reported casualties - 4 took place in 2002, and the lowest - 0 in 2004. The data has a decreasing trend.
The average number of casualties per 1,000 fire incidents is 7. This indicator was the highest - 39 in 2002, and the lowest 0 in 2004. The trend for injuries per 1,000 incidents is dropping. Compared to the state value the number of injuries per 1,000 fires is lower.
Based on the data from the years 2002 - 2018 the average number of fire-related casualties per year is 1. The highest number of reported casualties - 4 took place in 2002, and the lowest - 0 in 2004. The data has a decreasing trend.
The average number of casualties per 1,000 fire incidents is 7. This indicator was the highest - 39 in 2002, and the lowest 0 in 2004. The trend for injuries per 1,000 incidents is dropping. Compared to the state value the number of injuries per 1,000 fires is lower.Casualties per 1,000 incidents in Walker, MI compared to nearest cities:
(Note: Based on data for all years, including only cities with at least 500 fire incidents)
| Walker: | 8.7 |
| Comstock Park: | 15.0 |
| Grand Rapids: | 15.0 |
| Grandville: | 28.7 |
| Wyoming: | 36.2 |
| Allendale: | 4.6 |
| Kentwood: | 34.5 |
| Coopersville: | 0.0 |
| Sparta: | 0.0 |
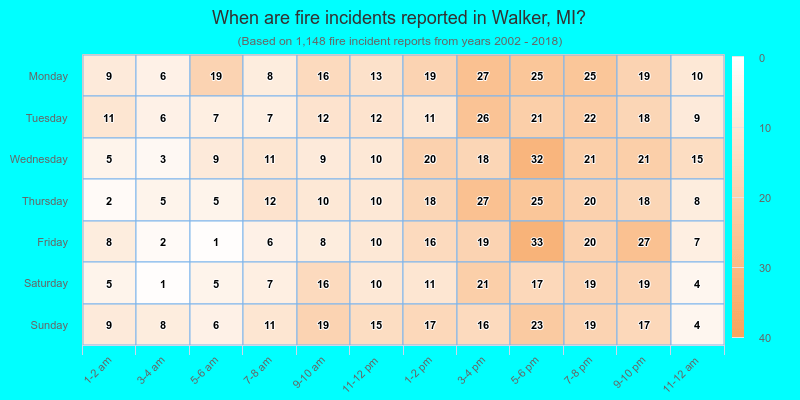
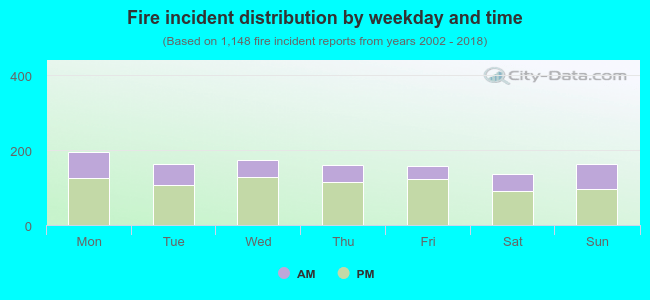 31.7% incidents where reported in the morning and 68.3% in the evening. The most fires (17.1%) took place on Monday, and the least (11.8%) on Saturday.
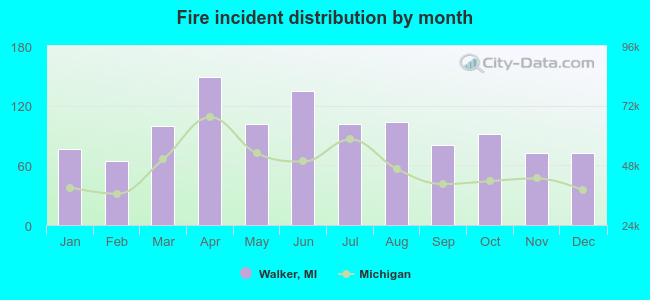 According to the 1,148 incident reports from years 2002 - 2018 most fires (13.0%) took place during April, and the least (5.6%) in February.
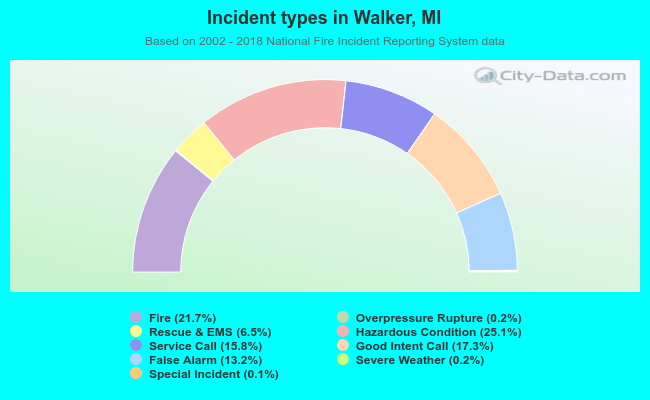 Out of all 5,293 cases reported during the years 2002 - 2018, the most belonged to the categories: Hazardous Condition (25.1%), Fire (21.7%), and Good Intent Call (17.3%).
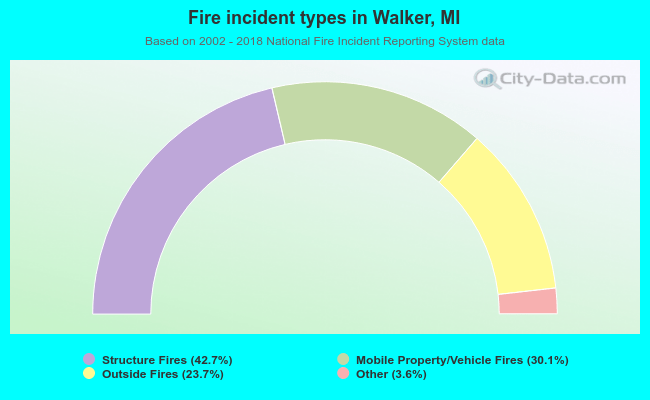 When looking into fire subcategories, the most incidents belonged to: Structure Fires (42.7%), and Mobile Property/Vehicle Fires (30.1%).