Grand Rapids: Fire Incidents, Michigan (MI)
Where are fire incidents reported in Grand Rapids, MI
Something went wrong! Please refresh the page.
| Fire incidents reported | |
|---|---|
| Sreet name | Count |
| 28TH ST | 342 |
| DIVISION AVE | 252 |
| LEONARD ST | 174 |
| KALAMAZOO AVE | 166 |
| PLAINFIELD AVE | 164 |
| SHELDON AVE | 160 |
| FULLER AVE | 152 |
| FULTON ST | 144 |
| BURTON ST | 142 |
| EASTERN AVE | 134 |
| IONIA AVE | 124 |
| EAST BELTLINE AVE | 120 |
| WALKER AVE | 120 |
| CASCADE RD | 110 |
| BRIDGE ST | 106 |
| PLAINFIELD AVE | 102 |
| MADISON AVE | 94 |
| LAFAYETTE AVE | 92 |
| 68TH ST | 86 |
| FRANKLIN ST | 86 |
| LAKE MICHIGAN DR | 84 |
| MICHIGAN ST | 80 |
| HALL ST | 78 |
| WEALTHY ST | 74 |
| WOODFIELD EAST DR | 74 |
| JEFFERSON AVE | 72 |
| COLLEGE AVE | 70 |
| KRAFT AVE | 70 |
| 4 MILE RD | 64 |
| 8TH AVE | 64 |
| Other | 3,605 |
2002 - 2018 National Fire Incident Reporting System (NFIRS) incidents
- Incident types reported to NFIRS in Grand Rapids, MI
- 82,37059.4%Rescue & EMS
- 17,77312.8%Good Intent Call
- 10,5107.6%Hazardous Condition
- 10,3007.4%Service Call
- 9,9247.2%False Alarm
- 7,2055.2%Fire
- 5480.4%Overpressure Rupture
- Fire incident types reported to NFIRS in Grand Rapids, MI
- 3,72851.7%Structure Fires
- 1,79724.9%Outside Fires
- 1,51521.0%Mobile Property/Vehicle Fires
- 1652.3%Other
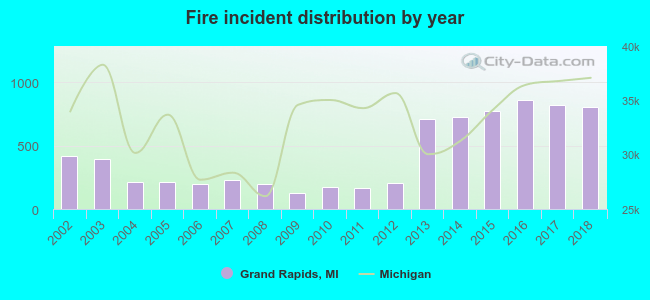 Based on the data from the years 2002 - 2018 the average number of fires per year is 424. The highest number of fire incidents - 856 took place in 2016, and the least - 128 in 2009. The data has a growing trend.
The average number of yearly fire incidents per 10k residents in Grand Rapids, MI compared to nearest cities:
(Note: Based on data for the last 3 years, including only cities with population 5,000 and above)
| Grand Rapids: | 42.6 |
| East Grand Rapids: | 6.8 |
| Wyoming: | 27.7 |
| Walker: | 31.9 |
| Comstock Park: | 62.8 |
| Kentwood: | 22.3 |
| Grandville: | 32.4 |
| Cutlerville: | 4.9 |
| Jenison: | 22.2 |
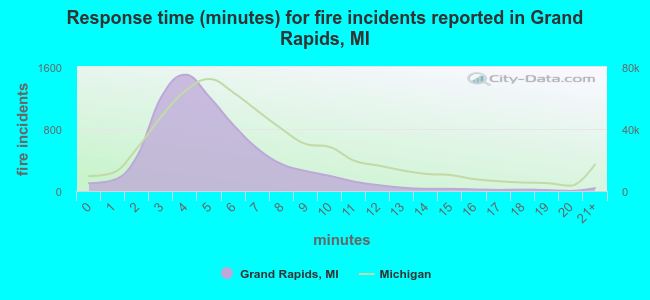 The median response time based on all reported fire incidents is 5 minutes. This is lower compared to the state median value.
The median response time in Grand Rapids, MI compared to nearest cities:
(Note: Based on data for all years, including only cities with at least 500 fire incidents)
| Grand Rapids: | 5 minutes |
| Wyoming: | 6 minutes |
| Walker: | 9 minutes |
| Comstock Park: | 7 minutes |
| Kentwood: | 5 minutes |
| Grandville: | 4 minutes |
| Byron Center: | 8 minutes |
| Rockford: | 6 minutes |
| Hudsonville: | 6 minutes |
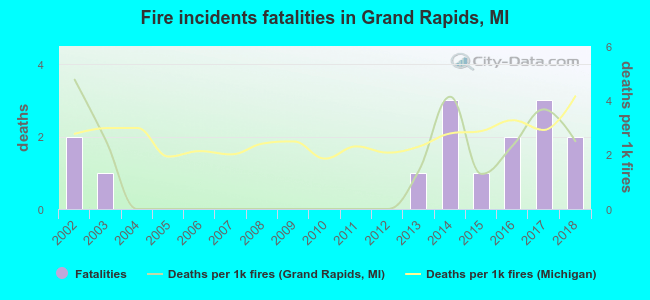 According to the reports from the years 2002 - 2018 the average number of fire-related fatalities per year is 1. The highest number of reported deaths - 3 took place in 2014, and the lowest - 0 in 2004. The data has a constant trend.
The average number of deaths per 1,000 fires is 1. This indicator was the highest - 5 in 2002, and the lowest 0 in 2004. The trend for deaths per 1,000 incidents is dropping. Compared to the Michigan value the number of fatalities per 1,000 incidents is lower.
According to the reports from the years 2002 - 2018 the average number of fire-related fatalities per year is 1. The highest number of reported deaths - 3 took place in 2014, and the lowest - 0 in 2004. The data has a constant trend.
The average number of deaths per 1,000 fires is 1. This indicator was the highest - 5 in 2002, and the lowest 0 in 2004. The trend for deaths per 1,000 incidents is dropping. Compared to the Michigan value the number of fatalities per 1,000 incidents is lower.
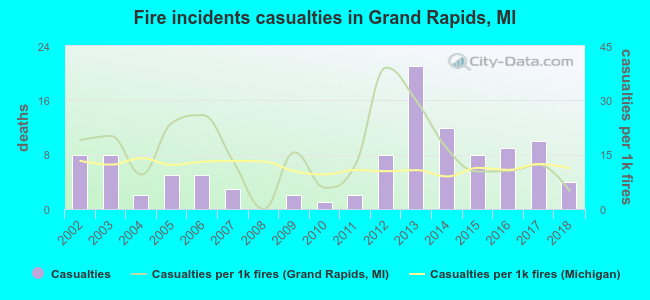 Based on the reports from the years 2002 - 2018 the average number of fire-related yearly casualties is 6. The highest number of casualties - 21 took place in 2013, and the lowest - 0 in 2008. The data has a decreasing trend.
The average number of casualties per 1,000 fires is 16. This indicator was the highest - 39 in 2012, and the lowest 0 in 2008. The trend for casualties per 1,000 fires is dropping. Compared to the Michigan value the number of injuries per 1,000 fires is higher.
Based on the reports from the years 2002 - 2018 the average number of fire-related yearly casualties is 6. The highest number of casualties - 21 took place in 2013, and the lowest - 0 in 2008. The data has a decreasing trend.
The average number of casualties per 1,000 fires is 16. This indicator was the highest - 39 in 2012, and the lowest 0 in 2008. The trend for casualties per 1,000 fires is dropping. Compared to the Michigan value the number of injuries per 1,000 fires is higher.Casualties per 1,000 incidents in Grand Rapids, MI compared to nearest cities:
(Note: Based on data for all years, including only cities with at least 500 fire incidents)
| Grand Rapids: | 15.0 |
| Wyoming: | 36.2 |
| Walker: | 8.7 |
| Comstock Park: | 15.0 |
| Kentwood: | 34.5 |
| Grandville: | 28.7 |
| Byron Center: | 0.0 |
| Rockford: | 4.8 |
| Hudsonville: | 4.7 |
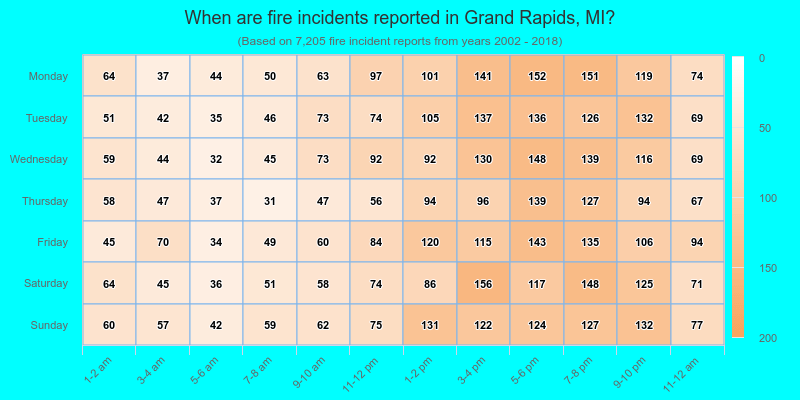
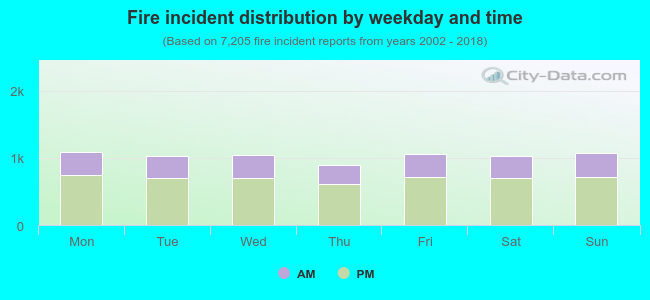 32.2% incidents where reported in the morning and 67.8% in the evening. The most fires (15.2%) took place on Monday, and the least (12.4%) on Thursday.
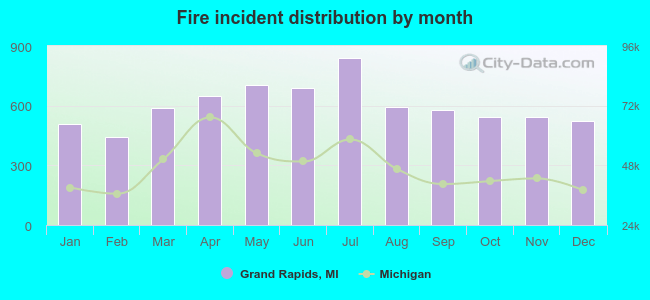 Based on the 7,205 fire incidents from years 2002 - 2018 most fires (11.6%) took place during July, and the least (6.1%) in February.
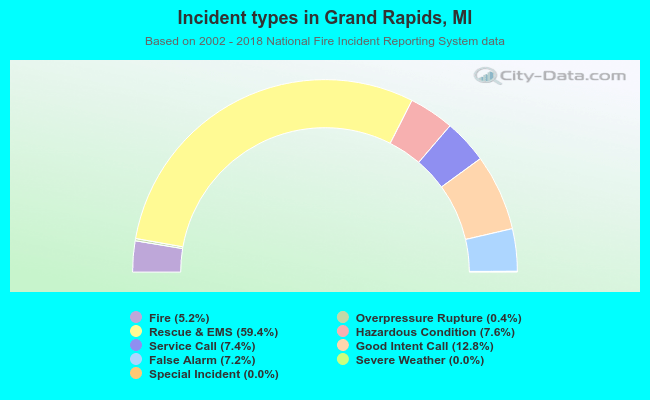 Out of all 138,745 cases reported during the years 2002 - 2018, the most belonged to the categories: Rescue & EMS (59.4%), Good Intent Call (12.8%), and Hazardous Condition (7.6%).
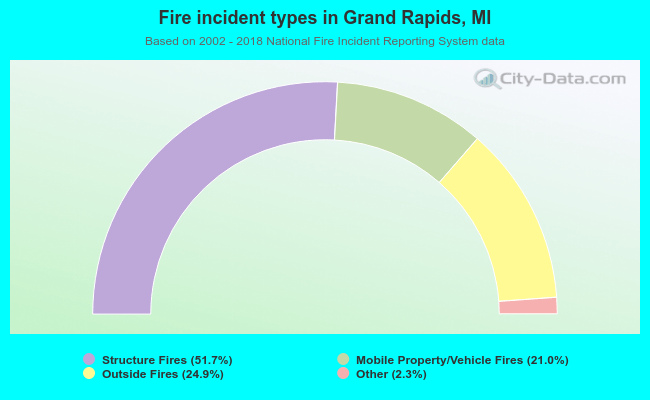 When looking into fire subcategories, the most incidents belonged to: Structure Fires (51.7%), and Outside Fires (24.9%).