Greenlawn: Fire Incidents, New York (NY)
Where are fire incidents reported in Greenlawn, NY
Something went wrong! Please refresh the page.
|
| |||||||||||||||||||||||||||||||||||||||||||||||||||||||||||||||||||||||||||||||||||||||||||||||||||||||||||||
2003 - 2018 National Fire Incident Reporting System (NFIRS) incidents
- Incident types reported to NFIRS in Greenlawn, NY
- 4,48079.6%Rescue & EMS
- 3426.1%Hazardous Condition
- 3396.0%False Alarm
- 1733.1%Good Intent Call
- 1472.6%Fire
- 1252.2%Service Call
- 130.2%Special Incident
- 100.2%Severe Weather
- Fire incident types reported to NFIRS in Greenlawn, NY
- 7047.6%Structure Fires
- 4631.3%Outside Fires
- 2416.3%Mobile Property/Vehicle Fires
- 74.8%Other
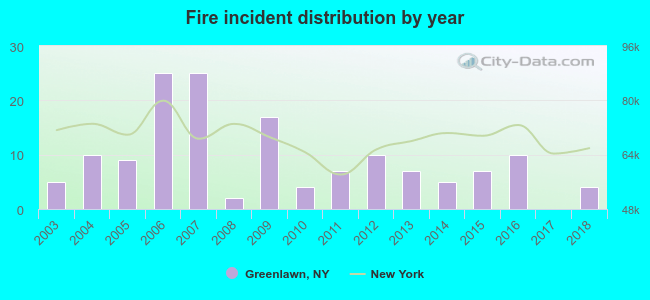 Based on the data from the years 2003 - 2018 the average number of fires per year is 9. The highest number of reported fires - 25 took place in 2006, and the least - 0 in 2017. The data has a decreasing trend.
The average number of yearly fire incidents per 10k residents in Greenlawn, NY compared to nearest cities:
(Note: Based on data for the last 3 years, including only cities with population 5,000 and above)
| Greenlawn: | 5.1 |
| Huntington Station: | 17.0 |
| Centerport: | 1.8 |
| East Northport: | 6.1 |
| Huntington: | 8.7 |
| Northport: | 32.8 |
| Cold Spring Harbor: | 4.6 |
| Commack: | 5.4 |
| Dix Hills: | 2.2 |
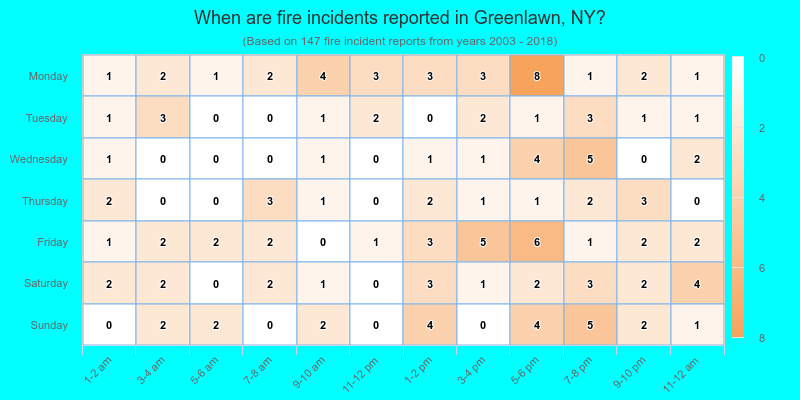
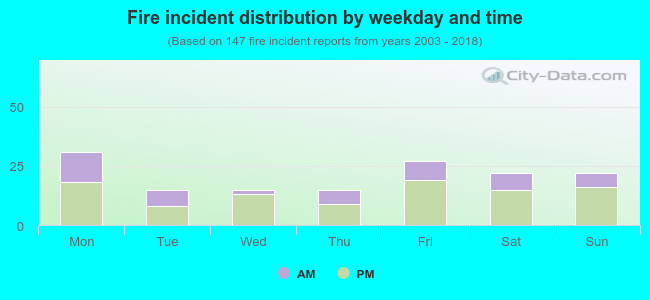 33.3% incidents where reported in the morning and 66.7% in the evening. The most fires (21.1%) took place on Monday, and the least (10.2%) on Tuesday.
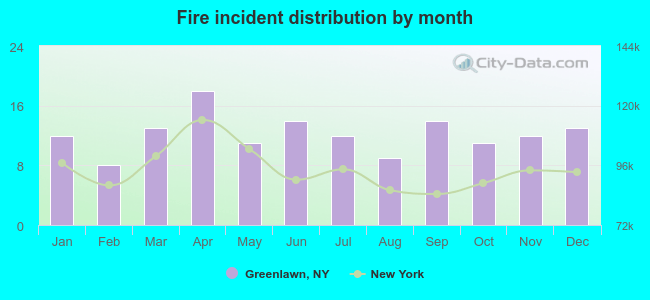 Based on the 147 fire incidents from years 2003 - 2018 most fires (12.2%) took place during April, and the least (5.4%) in February.
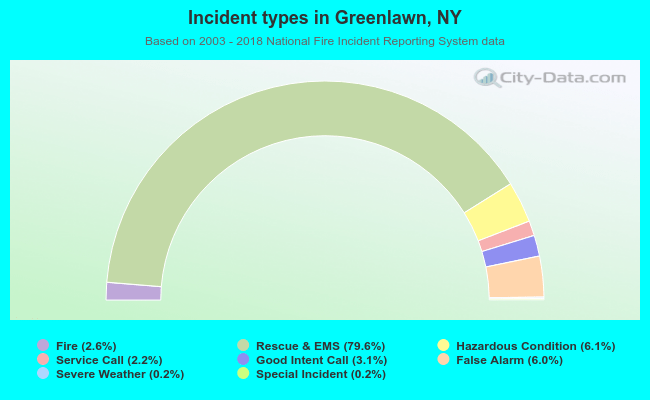 Out of all 5,629 cases reported during the years 2003 - 2018, the most belonged to the categories: Overpressure Rupture (79.6%), Rescue & EMS (6.1%), and Good Intent Call (6.0%).
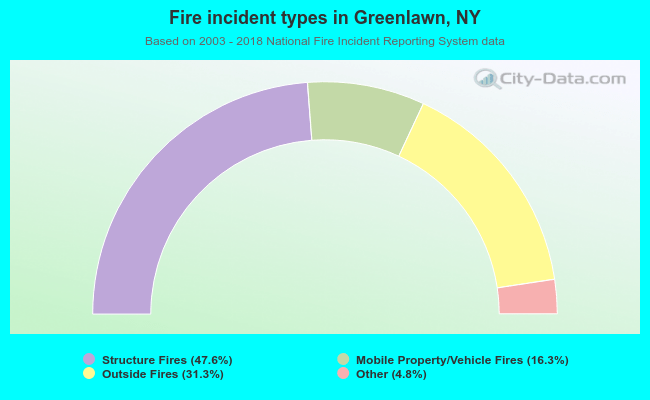 When looking into fire subcategories, the most incidents belonged to: Structure Fires (47.6%), and Outside Fires (31.3%).