Northport: Fire Incidents, New York (NY)
Where are fire incidents reported in Northport, NY
Something went wrong! Please refresh the page.
|
| |||||||||||||||||||||||||||||||||||||||||||||||||||||||||||||||||||||||||||||||||||||||||||||||||||||||||||||
2002 - 2018 National Fire Incident Reporting System (NFIRS) incidents
- Incident types reported to NFIRS in Northport, NY
- 2,81153.1%Rescue & EMS
- 80915.3%Hazardous Condition
- 76914.5%False Alarm
- 3506.6%Service Call
- 2775.2%Fire
- 2514.7%Good Intent Call
- 120.2%Overpressure Rupture
- 80.2%Special Incident
- Fire incident types reported to NFIRS in Northport, NY
- 13448.4%Outside Fires
- 11340.8%Structure Fires
- 176.1%Mobile Property/Vehicle Fires
- 134.7%Other
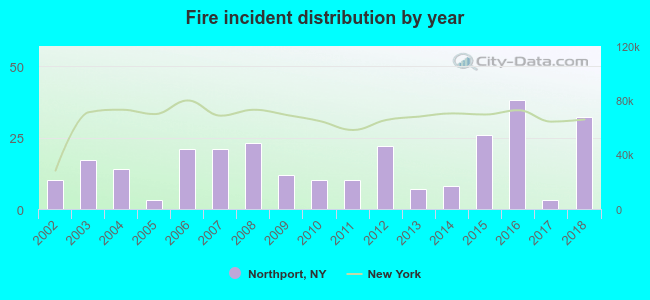 Based on the data from the years 2002 - 2018 the average number of fire incidents per year is 16. The highest number of reported fires - 38 took place in 2016, and the least - 3 in 2005. The data has an increasing trend.
The average number of yearly fire incidents per 10k residents in Northport, NY compared to nearest cities:
(Note: Based on data for the last 3 years, including only cities with population 5,000 and above)
| Northport: | 32.8 |
| Centerport: | 1.8 |
| East Northport: | 6.1 |
| Greenlawn: | 5.1 |
| Huntington: | 8.7 |
| Commack: | 5.4 |
| Huntington Station: | 17.0 |
| Kings Park: | 10.6 |
| Cold Spring Harbor: | 4.6 |

 24.2% incidents where reported in the morning and 75.8% in the evening. The most fires (16.6%) took place on Tuesday, and the least (11.9%) on Saturday.
 Based on the 277 incident reports from years 2002 - 2018 most fires (11.6%) took place during March, and the least (5.1%) in June.
 Out of all 5,292 cases reported during the years 2002 - 2018, the most belonged to the categories: Rescue & EMS (53.1%), Hazardous Condition (15.3%), and False Alarm (14.5%).
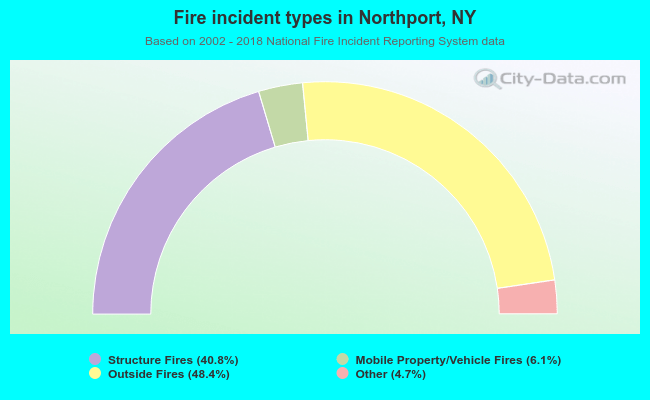 When looking into fire subcategories, the most reports belonged to: Outside Fires (48.4%), and Structure Fires (40.8%).