Huntington Station: Fire Incidents, New York (NY)
Where are fire incidents reported in Huntington Station, NY
Something went wrong! Please refresh the page.
|
| |||||||||||||||||||||||||||||||||||||||||||||||||||||||||||||||||||||||||||||||||||||||||||||||||||||||||||||
2006 - 2016 National Fire Incident Reporting System (NFIRS) incidents
- Incident types reported to NFIRS in Huntington Station, NY
- 1,88349.0%Hazardous Condition
- 60915.8%False Alarm
- 58415.2%Fire
- 40310.5%Service Call
- 2015.2%Rescue & EMS
- 1604.2%Good Intent Call
- Fire incident types reported to NFIRS in Huntington Station, NY
- 26345.0%Structure Fires
- 20234.6%Outside Fires
- 10918.7%Mobile Property/Vehicle Fires
- 101.7%Other
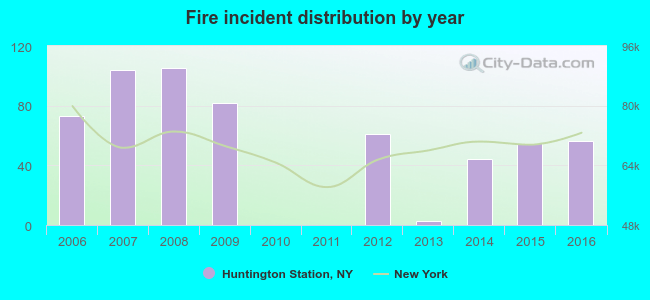 According to the data from the years 2006 - 2016 the average number of fires per year is 53. The highest number of fire incidents - 105 took place in 2008, and the least - 0 in 2010. The data has a decreasing trend.
The average number of yearly fire incidents per 10k residents in Huntington Station, NY compared to nearest cities:
(Note: Based on data for the last 3 years, including only cities with population 5,000 and above)
| Huntington Station: | 17.0 |
| Cold Spring Harbor: | 4.6 |
| Huntington: | 8.7 |
| Greenlawn: | 5.1 |
| Centerport: | 1.8 |
| Melville: | 9.8 |
| Woodbury: | 23.2 |
| East Northport: | 6.1 |
| Dix Hills: | 2.2 |
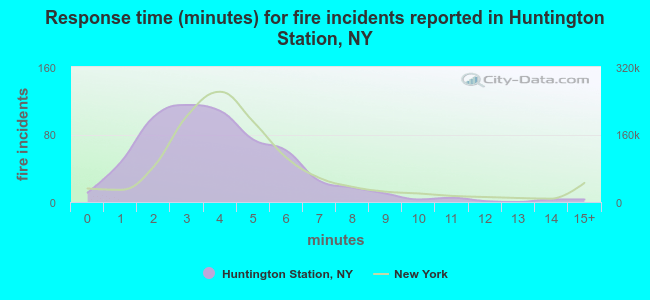 The median response time based on all reported fire incidents is 4 minutes. This is comparable to the state median value.
The median response time in Huntington Station, NY compared to nearest cities:
(Note: Based on data for all years, including only cities with at least 500 fire incidents)
| Huntington Station: | 4 minutes |
| Commack: | 5 minutes |
| Wyandanch: | 3 minutes |
| Hicksville: | 4 minutes |
| Brentwood: | 6 minutes |
| Levittown: | 3 minutes |
| Smithtown: | 6 minutes |
| West Islip: | 3 minutes |
| Hauppauge: | 4 minutes |
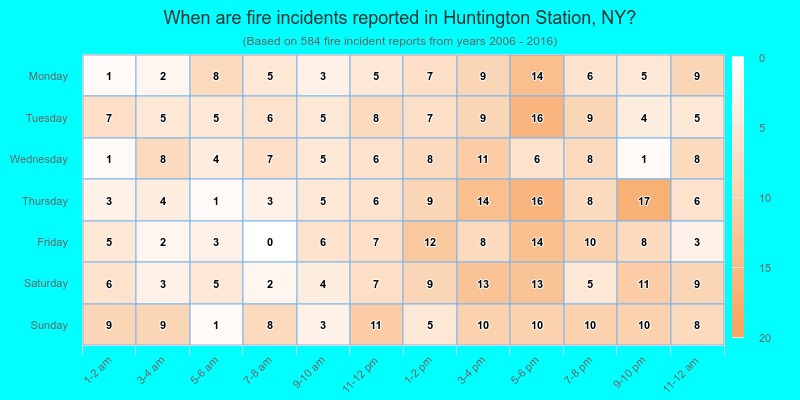
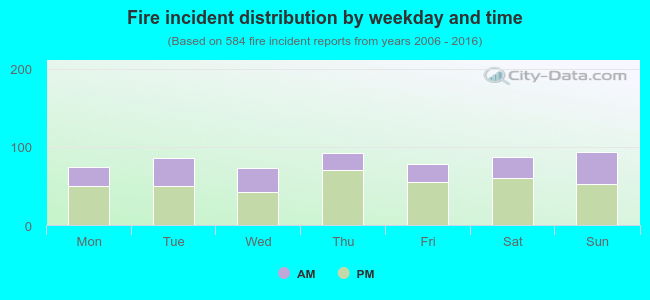 34.9% incidents where reported in the morning and 65.1% in the evening. The most fires (16.1%) took place on Sunday, and the least (12.5%) on Wednesday.
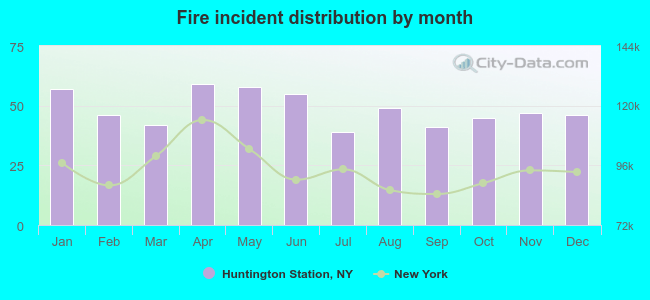 According to the 584 fire incidents from years 2006 - 2016 most fires (10.1%) took place during April, and the least (6.7%) in July.
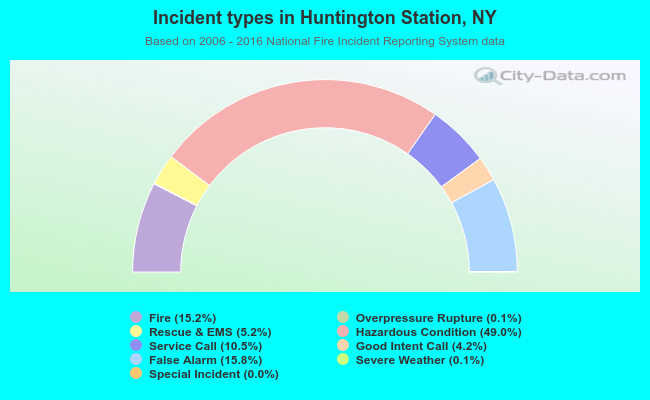 Out of all 3,846 cases reported during the years 2006 - 2016, the most belonged to the categories: Hazardous Condition (49.0%), False Alarm (15.8%), and Fire (15.2%).
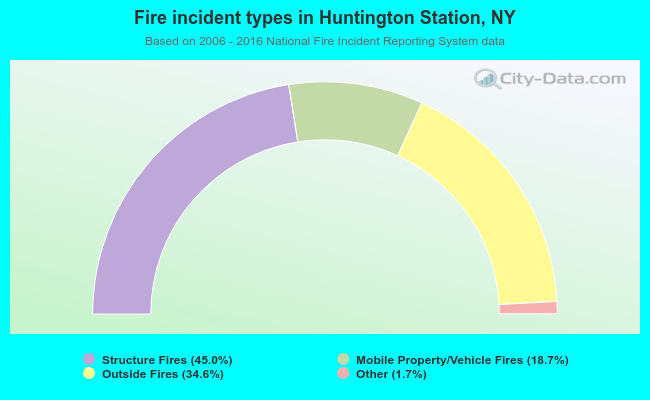 When looking into fire subcategories, the most incidents belonged to: Structure Fires (45.0%), and Outside Fires (34.6%).