New Whiteland: Fire Incidents, Indiana (IN)
Where are fire incidents reported in New Whiteland, IN
Something went wrong! Please refresh the page.
|
| |||||||||||||||||||||||||||||||||||||||||||||||||||||||||||||||||||||||||||||||||||||||||||||||||||||||||||||
2002 - 2018 National Fire Incident Reporting System (NFIRS) incidents
- Incident types reported to NFIRS in New Whiteland, IN
- 78352.3%Rescue & EMS
- 22915.3%Fire
- 22214.8%Hazardous Condition
- 1399.3%Good Intent Call
- 885.9%Service Call
- 261.7%False Alarm
- 50.3%Special Incident
- 40.3%Severe Weather
- Fire incident types reported to NFIRS in New Whiteland, IN
- 11550.2%Structure Fires
- 6227.1%Outside Fires
- 2711.8%Mobile Property/Vehicle Fires
- 2510.9%Other
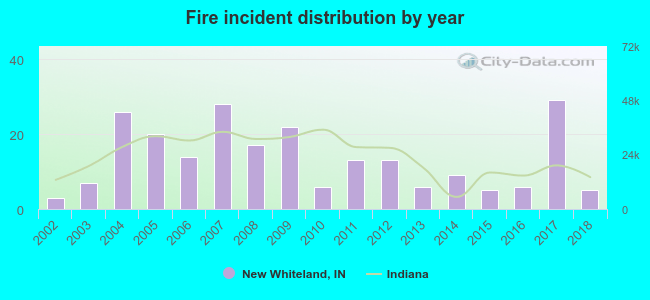 Based on the data from the years 2002 - 2018 the average number of fire incidents per year is 13. The highest number of reported fire incidents - 29 took place in 2017, and the least - 3 in 2002. The data has a growing trend.
The average number of yearly fire incidents per 10k residents in New Whiteland, IN compared to nearest cities:
(Note: Based on data for the last 3 years, including only cities with population 5,000 and above)
| New Whiteland: | 22.9 |
| Greenwood: | 12.8 |
| Bargersville: | 39.2 |
| Franklin: | 20.0 |
| Beech Grove: | 10.3 |
| Mooresville: | 102.3 |
| Indianapolis: | 5.2 |
| Shelbyville: | 38.1 |
| Speedway: | 40.2 |

 27.9% incidents where reported in the morning and 72.1% in the evening. The most fires (17.0%) took place on Tuesday, and the least (8.3%) on Monday.
 According to the 229 reports from years 2002 - 2018 most fires (12.7%) took place during December, and the least (4.8%) in June.
 Out of all 1,496 cases reported during the years 2002 - 2018, the most belonged to the categories: Overpressure Rupture (52.3%), Fire (15.3%), and Rescue & EMS (14.8%).
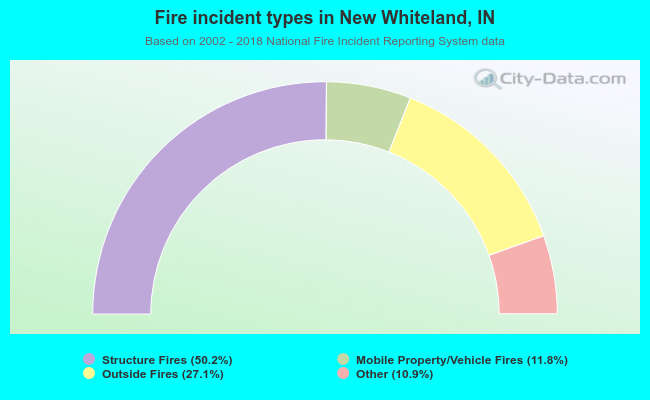 When looking into fire subcategories, the most incidents belonged to: Structure Fires (50.2%), and Outside Fires (27.1%).