Greenwood: Fire Incidents, South Carolina (SC)
Where are fire incidents reported in Greenwood, SC
Something went wrong! Please refresh the page.
| Fire incidents reported | |
|---|---|
| Sreet name | Count |
| MAIN ST | 190 |
| CAMBRIDGE AVE | 160 |
| PHOENIX ST | 106 |
| LIDE CT | 98 |
| MONTAGUE AVE | 98 |
| NEW MARKET ST | 78 |
| MARSHALL RD | 76 |
| BYPASS 72 | 70 |
| EMERALD RD | 68 |
| SPRING ST | 68 |
| TAGGART AVE | 68 |
| 72 BYP | 56 |
| PARKWAY | 56 |
| HOLMAN ST | 54 |
| REYNOLDS AVE | 54 |
| CALHOUN RD | 52 |
| EDGEFIELD ST | 50 |
| SPROLES AVE | 50 |
| MCNEILL AVE | 48 |
| GRACE ST | 46 |
| DURST AVE | 44 |
| LAUREL AVE | 34 |
| HOSPITAL ST | 32 |
| GROVE ST | 30 |
| MONTAGUE AVE EXT | 30 |
| COKESBURY RD | 28 |
| COKESBURY ST | 28 |
| MAXWELL AVE | 28 |
| 221 HWY | 26 |
| 72221 HWY | 26 |
| Other | 1,605 |
2002 - 2018 National Fire Incident Reporting System (NFIRS) incidents
- Incident types reported to NFIRS in Greenwood, SC
- 3,45731.6%Fire
- 2,05118.7%False Alarm
- 1,81316.5%Hazardous Condition
- 1,64415.0%Rescue & EMS
- 1,48913.6%Good Intent Call
- 4524.1%Service Call
- 200.2%Special Incident
- 180.2%Overpressure Rupture
- 130.1%Severe Weather
- Fire incident types reported to NFIRS in Greenwood, SC
- 1,78551.6%Structure Fires
- 96127.8%Outside Fires
- 56716.4%Mobile Property/Vehicle Fires
- 1444.2%Other
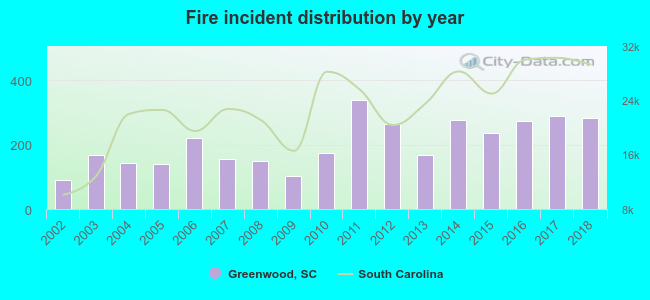 Based on the data from the years 2002 - 2018 the average number of fire incidents per year is 203. The highest number of reported fire incidents - 337 took place in 2011, and the least - 90 in 2002. The data has a rising trend.
The average number of yearly fire incidents per 10k residents in Greenwood, SC compared to nearest cities:
(Note: Based on data for the last 3 years, including only cities with population 5,000 and above)
| Greenwood: | 120.8 |
| Abbeville: | 203.6 |
| Laurens: | 164.5 |
| Clinton: | 103.6 |
| Newberry: | 88.9 |
| Homeland Park: | 192.2 |
| Fountain Inn: | 150.0 |
| Anderson: | 254.5 |
| Simpsonville: | 61.9 |
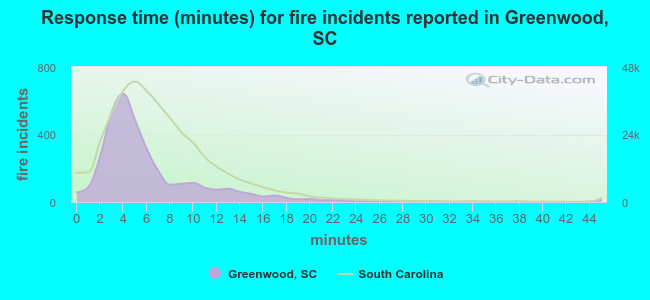 The median response time based on all reported fire incidents is 5 minutes. This is lower than the South Carolina median value.
The median response time in Greenwood, SC compared to nearest cities:
(Note: Based on data for all years, including only cities with at least 500 fire incidents)
| Greenwood: | 5 minutes |
| Abbeville: | 7 minutes |
| Ware Shoals: | 8 minutes |
| Donalds: | 7 minutes |
| Honea Path: | 5 minutes |
| Laurens: | 7 minutes |
| Clinton: | 6 minutes |
| Saluda: | 10 minutes |
| Gray Court: | 10 minutes |
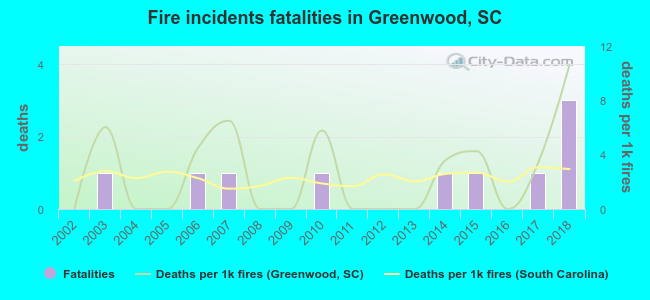 According to the data from the years 2002 - 2018 the average number of fire-related yearly deaths is 1. The highest number of deaths - 3 took place in 2018, and the lowest - 0 in 2002. The data has a rising trend.
The average number of fatalities per 1,000 fires is 3. This indicator was the highest - 11 in 2018, and the lowest 0 in 2002. The trend for deaths per 1,000 fires is rising. Compared to the state value the number of fatalities per 1,000 incidents is higher.
According to the data from the years 2002 - 2018 the average number of fire-related yearly deaths is 1. The highest number of deaths - 3 took place in 2018, and the lowest - 0 in 2002. The data has a rising trend.
The average number of fatalities per 1,000 fires is 3. This indicator was the highest - 11 in 2018, and the lowest 0 in 2002. The trend for deaths per 1,000 fires is rising. Compared to the state value the number of fatalities per 1,000 incidents is higher.Deaths per 1,000 incidents in Greenwood, SC compared to nearest cities:
(Note: Based on data for all years, including only cities with at least 2,500 fire incidents)
| Greenwood: | 2.9 |
| Anderson: | 3.0 |
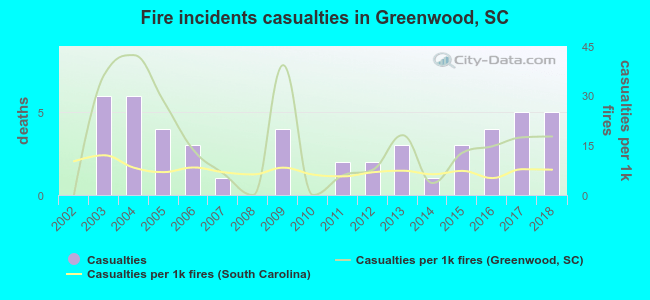 According to the data from the years 2002 - 2018 the average number of fire-related casualties per year is 3. The highest number of reported injuries - 6 took place in 2003, and the lowest - 0 in 2002. The data has a growing trend.
The average number of casualties per 1,000 fire incidents is 16. This indicator was the highest - 42 in 2004, and the lowest 0 in 2002. The trend for injuries per 1,000 fires is increasing. Compared to the South Carolina value the number of injuries per 1,000 fires is higher.
According to the data from the years 2002 - 2018 the average number of fire-related casualties per year is 3. The highest number of reported injuries - 6 took place in 2003, and the lowest - 0 in 2002. The data has a growing trend.
The average number of casualties per 1,000 fire incidents is 16. This indicator was the highest - 42 in 2004, and the lowest 0 in 2002. The trend for injuries per 1,000 fires is increasing. Compared to the South Carolina value the number of injuries per 1,000 fires is higher.Casualties per 1,000 incidents in Greenwood, SC compared to nearest cities:
(Note: Based on data for all years, including only cities with at least 500 fire incidents)
| Greenwood: | 14.2 |
| Abbeville: | 6.5 |
| Ware Shoals: | 3.1 |
| Donalds: | 2.0 |
| Honea Path: | 10.6 |
| Laurens: | 4.6 |
| Clinton: | 1.4 |
| Saluda: | 0.0 |
| Gray Court: | 4.1 |
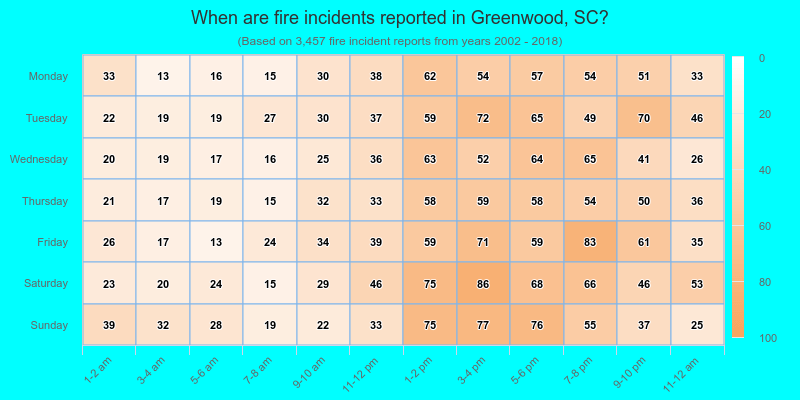
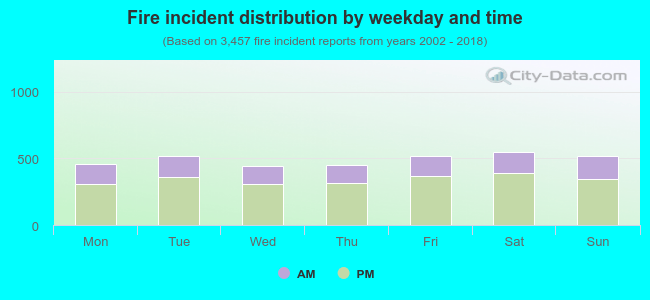 30.4% incidents where reported in the morning and 69.6% in the evening. The most fires (15.9%) took place on Saturday, and the least (12.8%) on Wednesday.
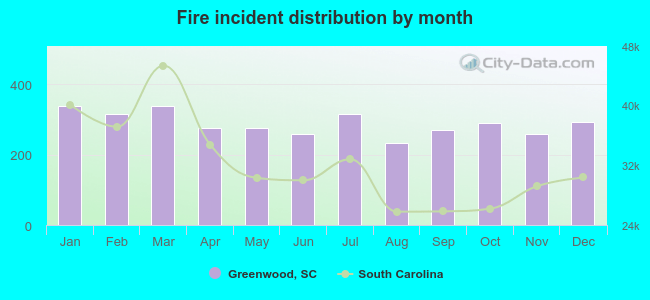 According to the 3,457 reports from years 2002 - 2018 most fires (9.8%) took place during January, and the least (6.7%) in August.
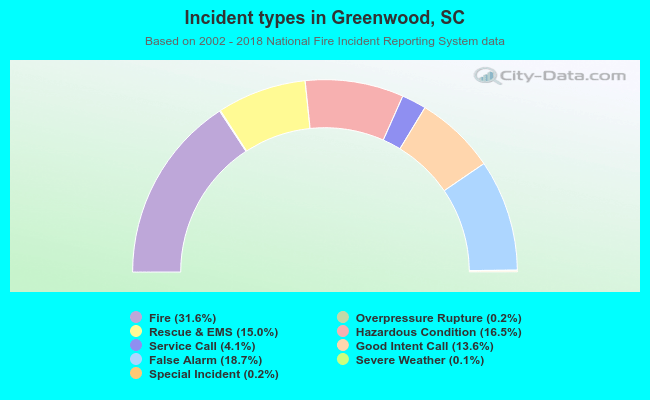 Out of all 10,957 cases reported during the years 2002 - 2018, the most belonged to the categories: Fire (31.6%), False Alarm (18.7%), and Hazardous Condition (16.5%).
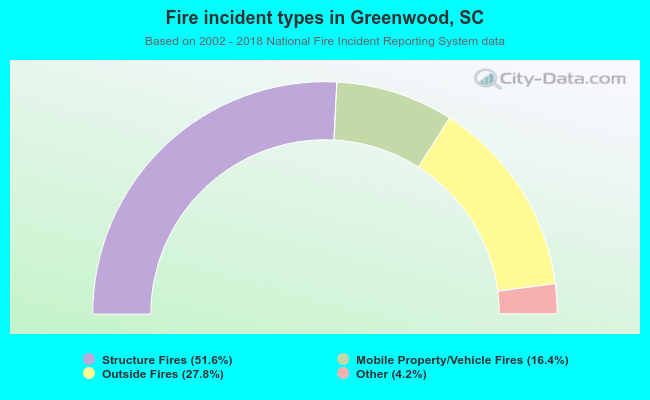 When looking into fire subcategories, the most reports belonged to: Structure Fires (51.6%), and Outside Fires (27.8%).