Newberry: Fire Incidents, South Carolina (SC)
Where are fire incidents reported in Newberry, SC
Something went wrong! Please refresh the page.
| Fire incidents reported | |
|---|---|
| Sreet name | Count |
| WILSON RD | 240 |
| MAIN ST | 198 |
| COLLEGE ST | 136 |
| NANCE ST | 96 |
| DRAYTON ST | 88 |
| GLENN ST | 74 |
| NANCE FOREST | 74 |
| WISE ST | 72 |
| HUNT ST | 58 |
| I26 | 54 |
| JOHNSTONE ST | 54 |
| BOUNDARY ST | 50 |
| CALDWELL ST | 50 |
| ADELAIDE ST | 46 |
| BENEDICT ST | 44 |
| KINARD ST | 40 |
| NEWBERRY ARMS | 38 |
| WRIGHT ST | 38 |
| CLINE ST | 32 |
| PALMETTO POINTE DR | 32 |
| LOUIS RICH RD | 30 |
| VINCENT ST | 30 |
| MYRTLE ST | 28 |
| SUBER DR | 28 |
| MILLIGAN ST | 26 |
| GRANT AVE | 24 |
| KENDALL RD | 24 |
| POPE ST | 24 |
| FAIR ST | 22 |
| HARRIS ST | 22 |
2003 - 2018 National Fire Incident Reporting System (NFIRS) incidents
- Incident types reported to NFIRS in Newberry, SC
- 1,69839.8%Fire
- 99023.2%Hazardous Condition
- 59013.8%False Alarm
- 4069.5%Service Call
- 3087.2%Rescue & EMS
- 2275.3%Good Intent Call
- 190.4%Overpressure Rupture
- 190.4%Severe Weather
- 140.3%Special Incident
- Fire incident types reported to NFIRS in Newberry, SC
- 91453.8%Structure Fires
- 42925.3%Outside Fires
- 31518.6%Mobile Property/Vehicle Fires
- 402.4%Other
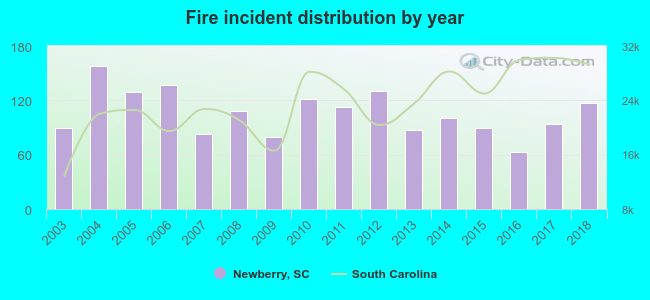 According to the data from the years 2003 - 2018 the average number of fire incidents per year is 106. The highest number of reported fires - 158 took place in 2004, and the least - 63 in 2016. The data has an increasing trend.
The average number of yearly fire incidents per 10k residents in Newberry, SC compared to nearest cities:
(Note: Based on data for the last 3 years, including only cities with population 5,000 and above)
| Newberry: | 88.9 |
| Clinton: | 103.6 |
| Laurens: | 164.5 |
| Irmo: | 83.5 |
| Lexington: | 285.2 |
| Union: | 106.5 |
| Greenwood: | 120.8 |
| Oak Grove: | 1.0 |
| West Columbia: | 246.6 |
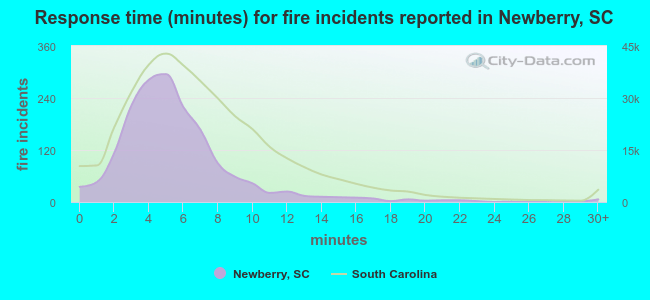 The median response time based on all reported fire incidents is 5 minutes. This is lower compared to the South Carolina median value.
The median response time in Newberry, SC compared to nearest cities:
(Note: Based on data for all years, including only cities with at least 500 fire incidents)
| Newberry: | 5 minutes |
| Chapin: | 8 minutes |
| Clinton: | 6 minutes |
| Saluda: | 10 minutes |
| Gilbert: | 8 minutes |
| Laurens: | 7 minutes |
| Irmo: | 8 minutes |
| Lexington: | 7 minutes |
| Union: | 6 minutes |
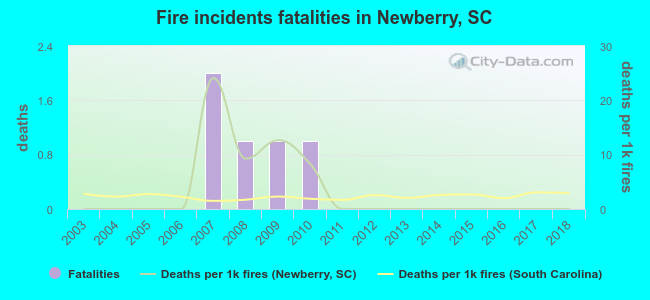 According to the reports from the years 2003 - 2018 the average number of fire-related yearly deaths is 0. The highest number of deaths - 2 took place in 2007, and the lowest - 0 in 2003. The data has a constant trend.
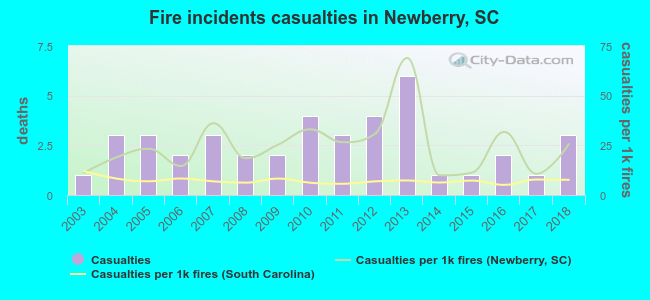 Based on the data from the years 2003 - 2018 the average number of fire-related casualties per year is 3. The highest number of injuries - 6 took place in 2013, and the lowest - 1 in 2003. The data has a rising trend.
The average number of casualties per 1,000 fires is 25. This indicator was the highest - 69 in 2013, and the lowest 10 in 2014. The trend for injuries per 1,000 fire incidents is increasing. Compared to the South Carolina value the number of casualties per 1,000 fire incidents is much higher.
Based on the data from the years 2003 - 2018 the average number of fire-related casualties per year is 3. The highest number of injuries - 6 took place in 2013, and the lowest - 1 in 2003. The data has a rising trend.
The average number of casualties per 1,000 fires is 25. This indicator was the highest - 69 in 2013, and the lowest 10 in 2014. The trend for injuries per 1,000 fire incidents is increasing. Compared to the South Carolina value the number of casualties per 1,000 fire incidents is much higher.
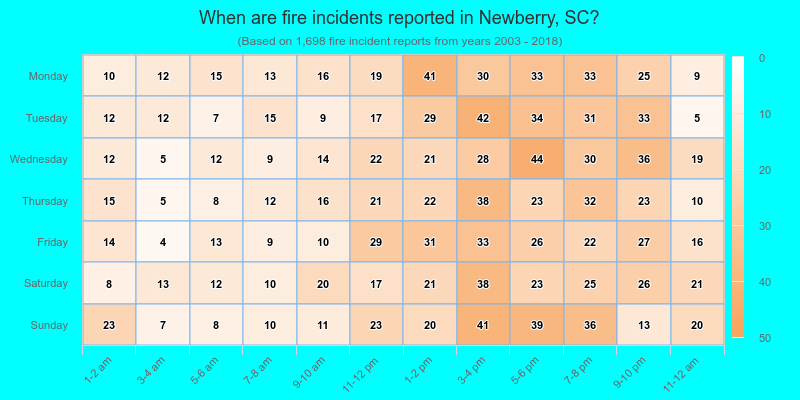
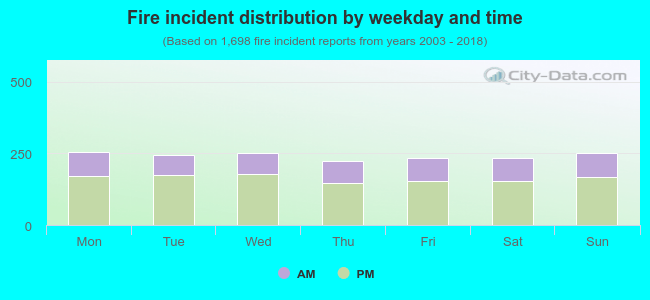 32.3% incidents where reported in the morning and 67.7% in the evening. The most fires (15.1%) took place on Monday, and the least (13.3%) on Thursday.
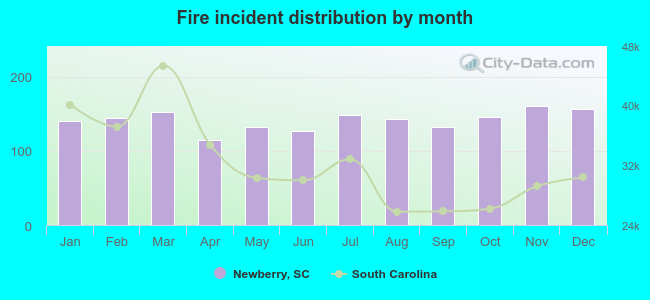 Based on the 1,698 incident reports from years 2003 - 2018 most fires (9.5%) took place during November, and the least (6.8%) in April.
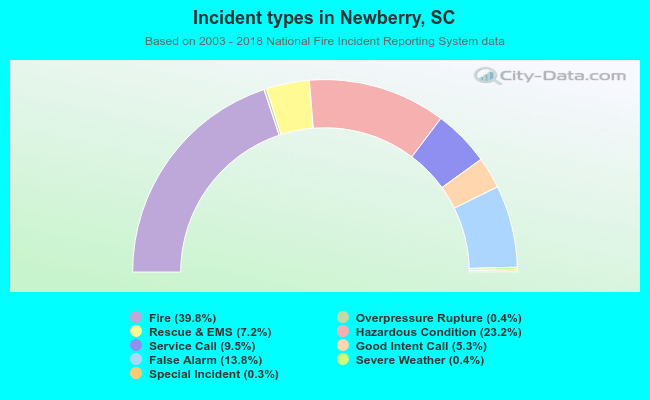 Out of all 4,271 cases reported during the years 2003 - 2018, the most belonged to the categories: Fire (39.8%), Hazardous Condition (23.2%), and False Alarm (13.8%).
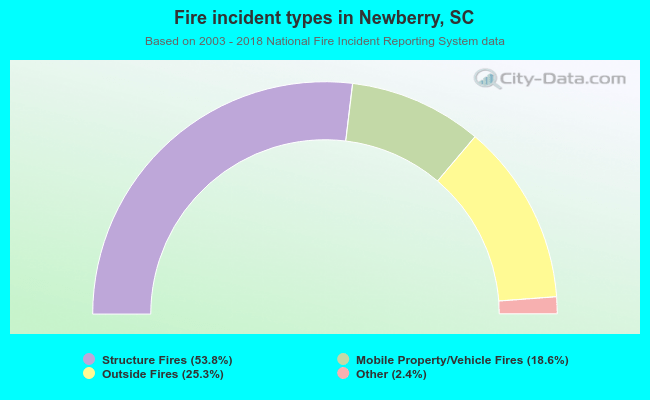 When looking into fire subcategories, the most reports belonged to: Structure Fires (53.8%), and Outside Fires (25.3%).