Grosse Ile: Fire Incidents, Michigan (MI)
Where are fire incidents reported in Grosse Ile, MI
Something went wrong! Please refresh the page.
|
| |||||||||||||||||||||||||||||||||||||||||||||||||||||||||||||||||||||||||||||||||||||||||||||||||||||||||||||
2002 - 2018 National Fire Incident Reporting System (NFIRS) incidents
- Incident types reported to NFIRS in Grosse Ile, MI
- 44343.9%Hazardous Condition
- 18318.1%Fire
- 16916.7%False Alarm
- 767.5%Good Intent Call
- 525.2%Rescue & EMS
- 525.2%Severe Weather
- 313.1%Service Call
- 20.2%Special Incident
- Fire incident types reported to NFIRS in Grosse Ile, MI
- 9954.1%Structure Fires
- 4625.1%Outside Fires
- 2312.6%Mobile Property/Vehicle Fires
- 158.2%Other
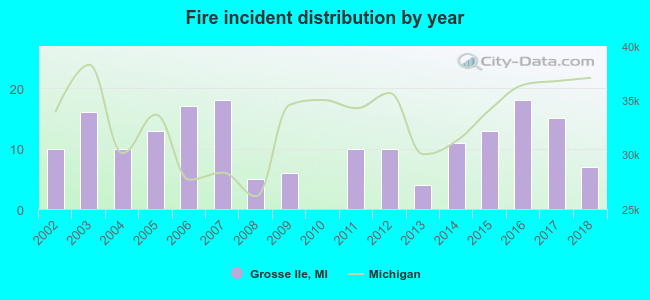 According to the data from the years 2002 - 2018 the average number of fires per year is 11. The highest number of reported fires - 18 took place in 2007, and the least - 0 in 2010. The data has a dropping trend.
The average number of yearly fire incidents per 10k residents in Grosse Ile, MI compared to nearest cities:
(Note: Based on data for the last 3 years, including only cities with population 5,000 and above)
| Grosse Ile: | 12.7 |
| Trenton: | 15.6 |
| Riverview: | 31.4 |
| Woodhaven: | 25.9 |
| Wyandotte: | 23.3 |
| Southgate: | 18.0 |
| Flat Rock: | 39.2 |
| Lincoln Park: | 28.0 |
| Ecorse: | 49.0 |
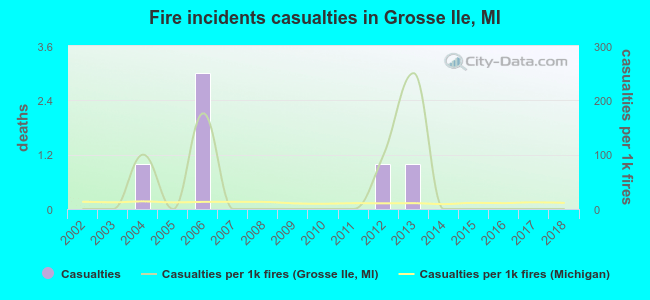 According to the data from the years 2002 - 2018 the average number of fire-related yearly casualties is 0. The highest number of injuries - 3 took place in 2006, and the lowest - 0 in 2002. The data has a constant trend.
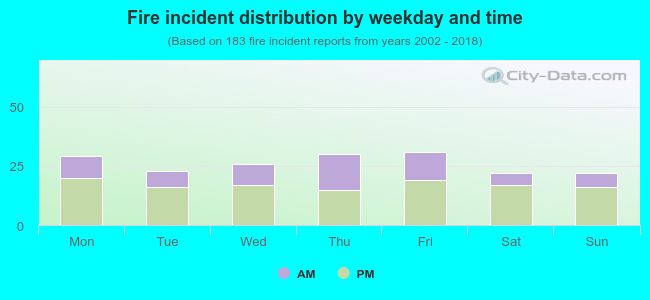 34.4% incidents where reported in the morning and 65.6% in the evening. The most fires (16.9%) took place on Friday, and the least (12.0%) on Saturday.
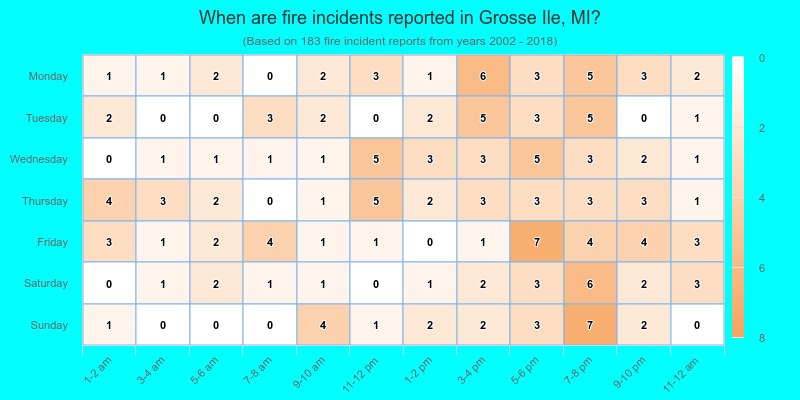
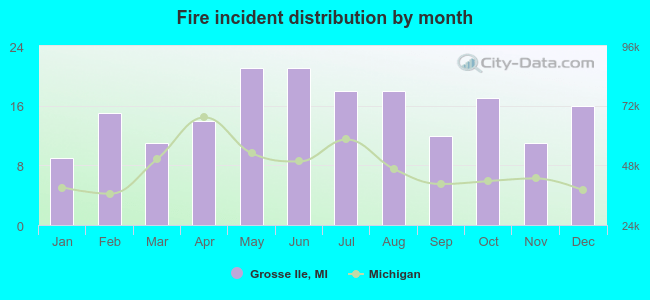 Based on the 183 fire incidents from years 2002 - 2018 most fires (11.5%) took place during May, and the least (4.9%) in January.
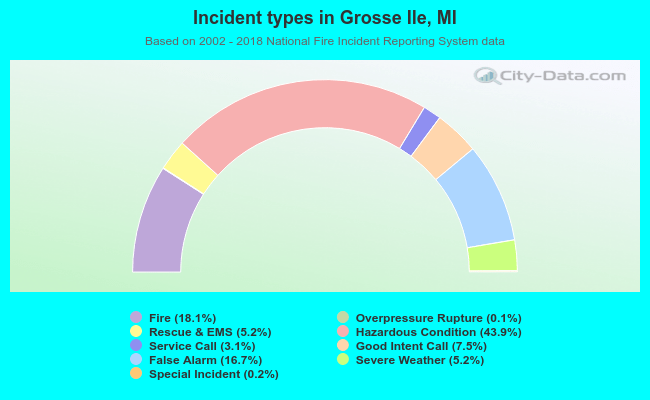 Out of all 1,009 cases reported during the years 2002 - 2018, the most belonged to the categories: Hazardous Condition (43.9%), Fire (18.1%), and False Alarm (16.7%).
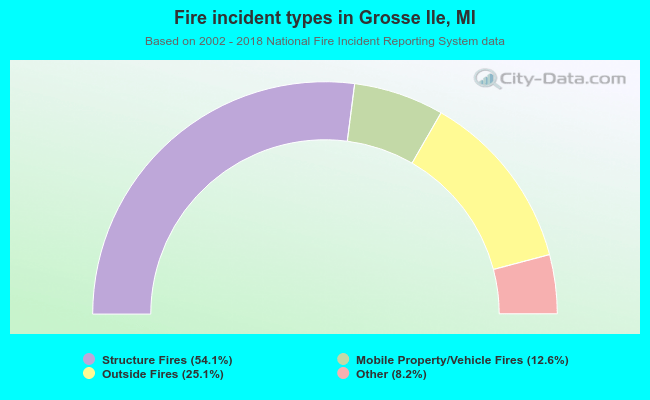 When looking into fire subcategories, the most incidents belonged to: Structure Fires (54.1%), and Outside Fires (25.1%).