Guilderland: Fire Incidents, New York (NY)
Where are fire incidents reported in Guilderland, NY
Something went wrong! Please refresh the page.
|
| |||||||||||||||||||||||||||||||||||||||||||||||||||||||||||||||||||||||||||||||||||||||||||||||||||||||||||||
2002 - 2018 National Fire Incident Reporting System (NFIRS) incidents
- Incident types reported to NFIRS in Guilderland, NY
- 50524.6%False Alarm
- 48823.7%Hazardous Condition
- 48523.6%Fire
- 36717.8%Good Intent Call
- 1004.9%Service Call
- 854.1%Rescue & EMS
- 120.6%Overpressure Rupture
- 110.5%Special Incident
- 40.2%Severe Weather
- Fire incident types reported to NFIRS in Guilderland, NY
- 33869.7%Structure Fires
- 8116.7%Outside Fires
- 489.9%Mobile Property/Vehicle Fires
- 183.7%Other
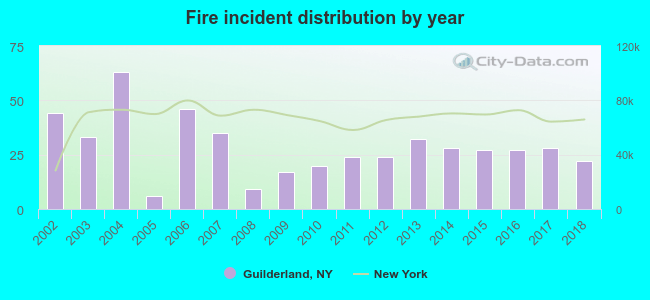 Based on the data from the years 2002 - 2018 the average number of fires per year is 29. The highest number of reported fires - 63 took place in 2004, and the least - 6 in 2005. The data has a decreasing trend.
The average number of yearly fire incidents per 10k residents in Guilderland, NY compared to nearest cities:
(Note: Based on data for the last 3 years, including only cities with population 5,000 and above)
| Guilderland: | 7.3 |
| Colonie: | 120.5 |
| Rotterdam: | 1.0 |
| Schenectady: | 72.1 |
| Delmar: | 28.2 |
| Albany: | 50.8 |
| Scotia: | 26.9 |
| Rensselaer: | 136.6 |
| Watervliet: | 23.5 |
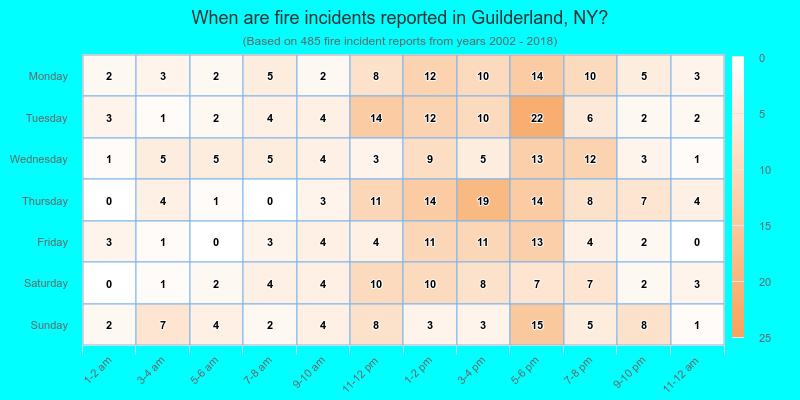
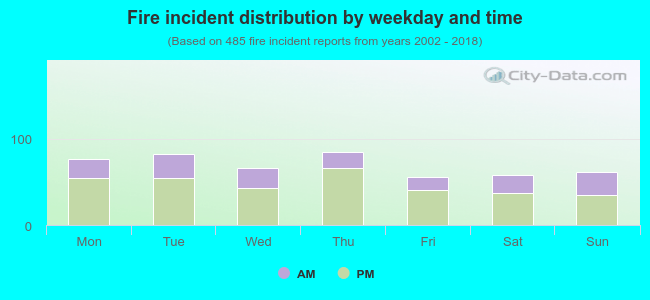 32.0% incidents where reported in the morning and 68.0% in the evening. The most fires (17.5%) took place on Thursday, and the least (11.5%) on Friday.
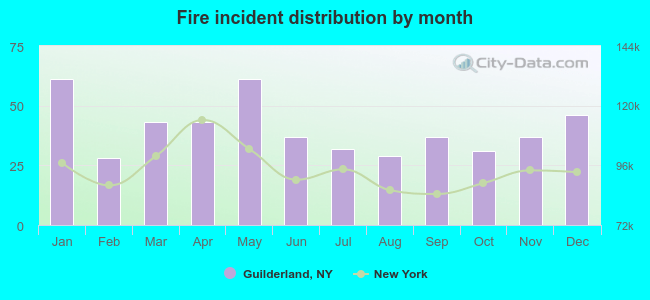 Based on the 485 fire incidents from years 2002 - 2018 most fires (12.6%) took place during January, and the least (5.8%) in February.
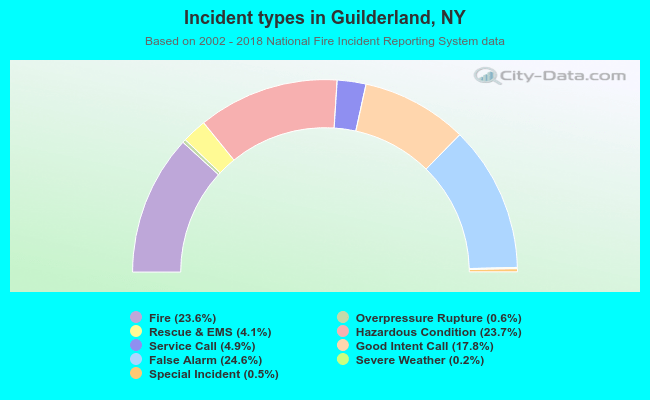 Out of all 2,057 cases reported during the years 2002 - 2018, the most belonged to the categories: False Alarm (24.6%), Hazardous Condition (23.7%), and Fire (23.6%).
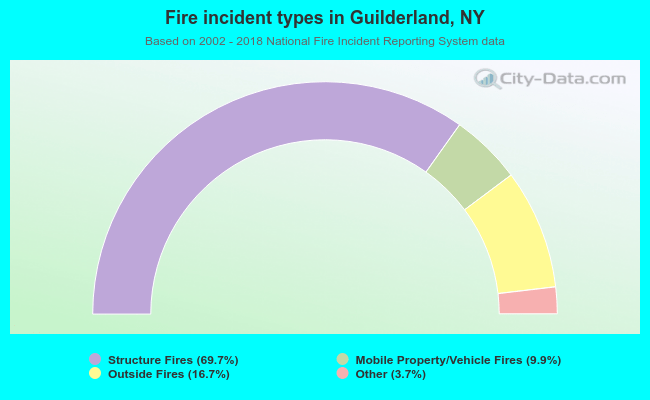 When looking into fire subcategories, the most incidents belonged to: Structure Fires (69.7%), and Outside Fires (16.7%).