Schenectady: Fire Incidents, New York (NY)
Where are fire incidents reported in Schenectady, NY
Something went wrong! Please refresh the page.
| Fire incidents reported | |
|---|---|
| Sreet name | Count |
| ALBANY ST | 1,778 |
| STATE ST | 838 |
| NOTT TER | 606 |
| BROADWAY | 550 |
| UNION ST | 342 |
| BROADWAY . | 296 |
| CHRISLER AVE | 274 |
| WASHINGTON AVE | 260 |
| VAN VRANKEN AVE | 240 |
| UNION AVE | 218 |
| SEWARD PL | 208 |
| CRANE ST | 166 |
| MCCLELLAN ST | 162 |
| FOSTER AVE | 156 |
| GUILDERLAND AVE | 150 |
| ALTAMONT AVE | 148 |
| CURRY RD | 146 |
| NOTT ST | 142 |
| DUANESBURG RD | 138 |
| BRANDYWINE AVE | 126 |
| CARMAN RD | 116 |
| KINGS RD | 112 |
| NOTT TERR | 102 |
| EASTERN PKY | 100 |
| EASTERN AVE | 96 |
| HURON CT | 96 |
| NYS THRUWAY | 96 |
| BALLTOWN RD | 94 |
| LENOX RD | 94 |
| CAMPBELL AVE | 92 |
| Other | 872 |
2002 - 2018 National Fire Incident Reporting System (NFIRS) incidents
- Incident types reported to NFIRS in Schenectady, NY
- 49,51453.7%Rescue & EMS
- 12,14913.2%False Alarm
- 8,9179.7%Hazardous Condition
- 8,8149.6%Fire
- 6,9997.6%Service Call
- 5,5706.0%Good Intent Call
- 1290.1%Special Incident
- Fire incident types reported to NFIRS in Schenectady, NY
- 5,60563.6%Structure Fires
- 1,86021.1%Outside Fires
- 7999.1%Mobile Property/Vehicle Fires
- 5506.2%Other
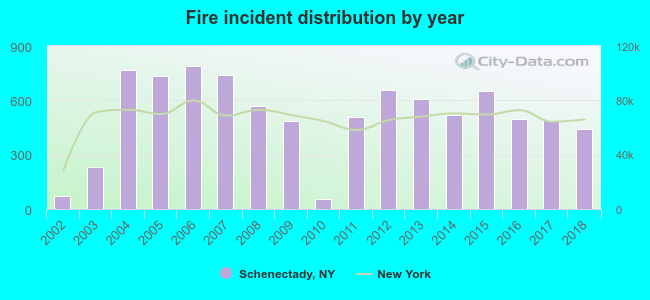 According to the data from the years 2002 - 2018 the average number of fire incidents per year is 518. The highest number of fires - 792 took place in 2006, and the least - 56 in 2010. The data has an increasing trend.
The average number of yearly fire incidents per 10k residents in Schenectady, NY compared to nearest cities:
(Note: Based on data for the last 3 years, including only cities with population 5,000 and above)
| Schenectady: | 72.1 |
| Rotterdam: | 1.0 |
| Scotia: | 26.9 |
| Glenville: | 67.6 |
| East Glenville: | 1.5 |
| Guilderland: | 7.3 |
| Clifton Park: | 34.1 |
| Colonie: | 120.5 |
| Halfmoon: | 15.6 |
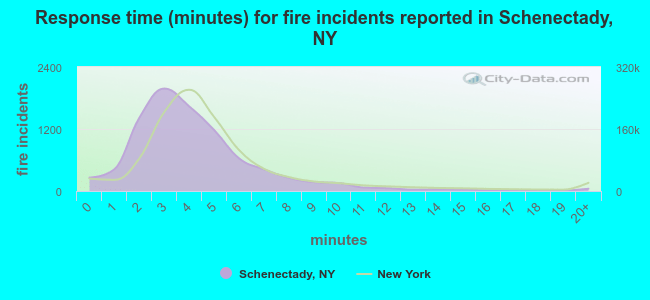 The median response time based on all reported fire incidents is 4 minutes. This is about the same as the state median value.
The median response time in Schenectady, NY compared to nearest cities:
(Note: Based on data for all years, including only cities with at least 500 fire incidents)
| Schenectady: | 4 minutes |
| Niskayuna: | 4 minutes |
| Glenville: | 4 minutes |
| Clifton Park: | 6 minutes |
| Colonie: | 7 minutes |
| Halfmoon: | 6 minutes |
| Cohoes: | 4 minutes |
| Albany: | 5 minutes |
| Waterford: | 5 minutes |
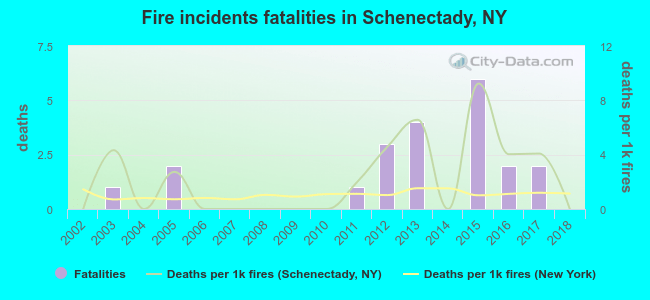 According to the data from the years 2002 - 2018 the average number of fire-related yearly deaths is 1. The highest number of reported deaths - 6 took place in 2015, and the lowest - 0 in 2002. The data has a constant trend.
The average number of deaths per 1,000 fire incidents is 2. This indicator was the highest - 9 in 2015, and the lowest 0 in 2002. The trend for deaths per 1,000 fires is constant. Compared to the state value the number of deaths per 1,000 incidents is much higher.
According to the data from the years 2002 - 2018 the average number of fire-related yearly deaths is 1. The highest number of reported deaths - 6 took place in 2015, and the lowest - 0 in 2002. The data has a constant trend.
The average number of deaths per 1,000 fire incidents is 2. This indicator was the highest - 9 in 2015, and the lowest 0 in 2002. The trend for deaths per 1,000 fires is constant. Compared to the state value the number of deaths per 1,000 incidents is much higher.Deaths per 1,000 incidents in Schenectady, NY compared to nearest cities:
(Note: Based on data for all years, including only cities with at least 2,500 fire incidents)
| Schenectady: | 2.4 |
| Albany: | 1.6 |
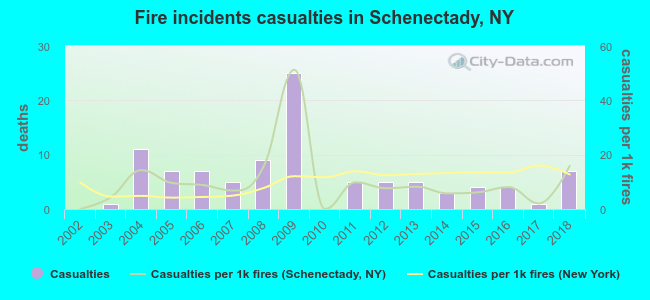 Based on the reports from the years 2002 - 2018 the average number of fire-related casualties per year is 6. The highest number of reported casualties - 25 took place in 2009, and the lowest - 0 in 2002. The data has a growing trend.
The average number of injuries per 1,000 fire incidents is 10. This indicator was the highest - 51 in 2009, and the lowest 0 in 2002. The trend for casualties per 1,000 incidents is rising. Compared to the state value the number of injuries per 1,000 fire incidents is about the same.
Based on the reports from the years 2002 - 2018 the average number of fire-related casualties per year is 6. The highest number of reported casualties - 25 took place in 2009, and the lowest - 0 in 2002. The data has a growing trend.
The average number of injuries per 1,000 fire incidents is 10. This indicator was the highest - 51 in 2009, and the lowest 0 in 2002. The trend for casualties per 1,000 incidents is rising. Compared to the state value the number of injuries per 1,000 fire incidents is about the same.
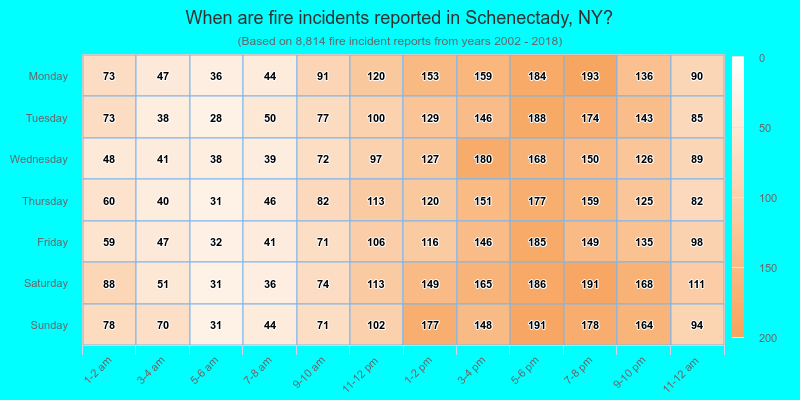
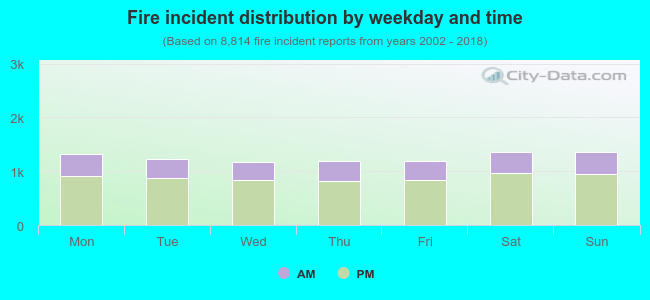 29.8% incidents where reported in the morning and 70.2% in the evening. The most fires (15.5%) took place on Saturday, and the least (13.3%) on Wednesday.
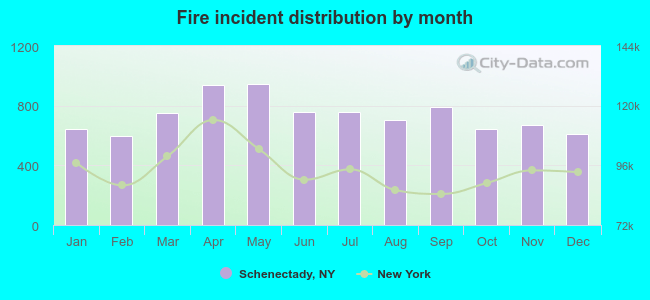 Based on the 8,814 incident reports from years 2002 - 2018 most fires (10.8%) took place during May, and the least (6.8%) in February.
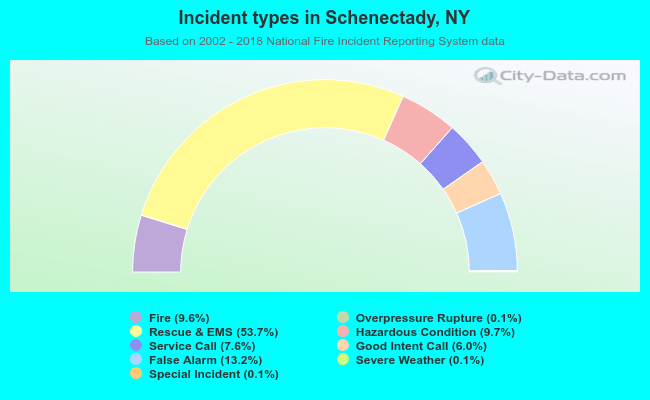 Out of all 92,188 cases reported during the years 2002 - 2018, the most belonged to the categories: Rescue & EMS (53.7%), False Alarm (13.2%), and Hazardous Condition (9.7%).
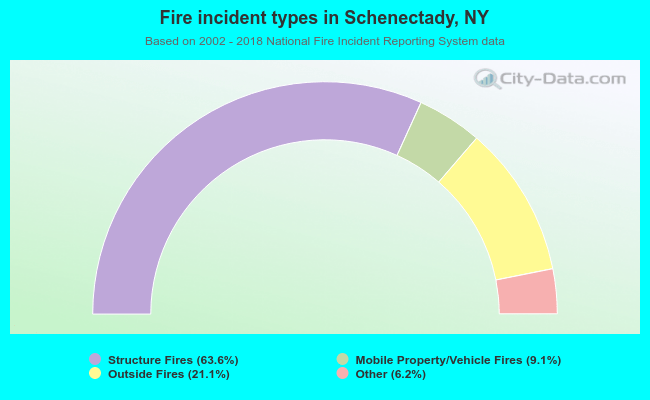 When looking into fire subcategories, the most incidents belonged to: Structure Fires (63.6%), and Outside Fires (21.1%).