Okmulgee: Fire Incidents, Oklahoma (OK)
Where are fire incidents reported in Okmulgee, OK
Something went wrong! Please refresh the page.
| Fire incidents reported | |
|---|---|
| Sreet name | Count |
| HWY 75 | 50 |
| HWY 56 | 42 |
| WOOD DR | 38 |
| 8TH | 34 |
| MISSION | 30 |
| 7TH | 28 |
| KENNEDY | 26 |
| OKMULGEE | 26 |
| 20TH | 24 |
| TAFT | 24 |
| 4TH | 22 |
| ALABAMA | 22 |
| KERN | 20 |
| OKLAHOMA AVE | 20 |
| OKMULGEE AVE | 20 |
| 3RD | 18 |
| 6TH | 18 |
| 6TH ST | 18 |
| GRAND | 18 |
| GUNCLUB | 18 |
| OKLAHOMA | 18 |
| OLD HWY 75 | 18 |
| 12TH | 16 |
| BRYAN | 16 |
| CELIA BERRYHILL RD | 16 |
| MISSION RD | 16 |
| 1ST | 14 |
| 20TH ST | 14 |
| 36TH ST | 14 |
| 3RD ST | 14 |
| Other | 597 |
2006 - 2018 National Fire Incident Reporting System (NFIRS) incidents
- Incident types reported to NFIRS in Okmulgee, OK
- 1,26938.9%Fire
- 53416.4%Hazardous Condition
- 45514.0%Rescue & EMS
- 40712.5%Service Call
- 2838.7%Good Intent Call
- 2758.4%False Alarm
- 280.9%Special Incident
- 50.2%Overpressure Rupture
- Fire incident types reported to NFIRS in Okmulgee, OK
- 66652.5%Outside Fires
- 35528.0%Structure Fires
- 16713.2%Mobile Property/Vehicle Fires
- 816.4%Other
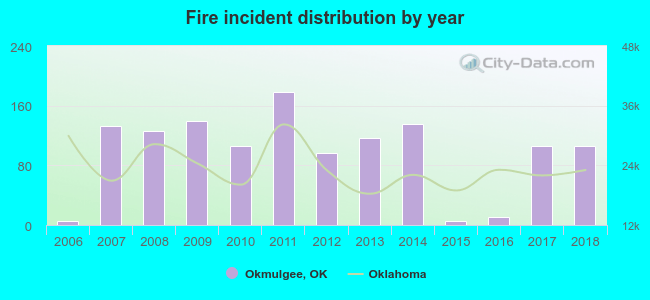 According to the data from the years 2006 - 2018 the average number of fires per year is 97. The highest number of fires - 178 took place in 2011, and the least - 5 in 2006. The data has a growing trend.
The average number of yearly fire incidents per 10k residents in Okmulgee, OK compared to nearest cities:
(Note: Based on data for the last 3 years, including only cities with population 5,000 and above)
| Okmulgee: | 60.8 |
| Henryetta: | 155.7 |
| Glenpool: | 49.5 |
| Bixby: | 20.1 |
| Jenks: | 35.9 |
| Sapulpa: | 90.7 |
| Coweta: | 31.5 |
| Broken Arrow: | 20.0 |
| Muskogee: | 81.2 |
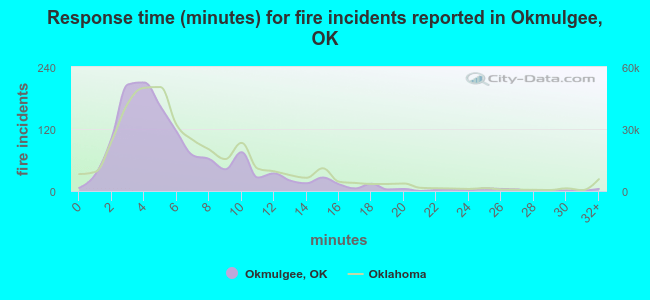 The median response time based on all reported fire incidents is 5 minutes. This is lower compared to the state median value.
The median response time in Okmulgee, OK compared to nearest cities:
(Note: Based on data for all years, including only cities with at least 500 fire incidents)
| Okmulgee: | 5 minutes |
| Morris: | 10 minutes |
| Beggs: | 10 minutes |
| Henryetta: | 7 minutes |
| Glenpool: | 4 minutes |
| Bixby: | 5 minutes |
| Jenks: | 5 minutes |
| Sapulpa: | 5 minutes |
| Bristow: | 8 minutes |
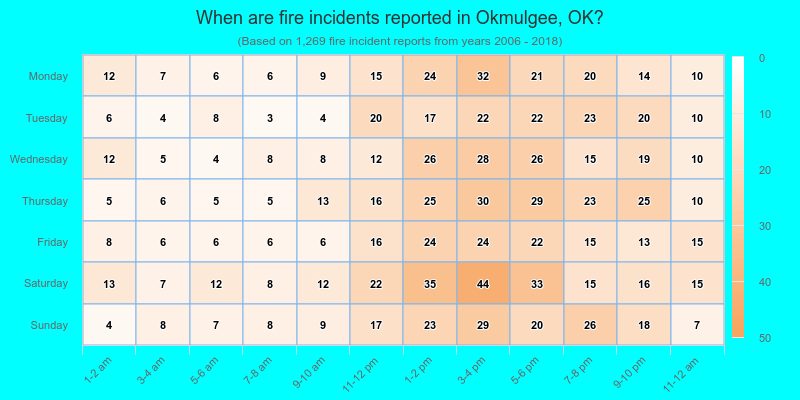
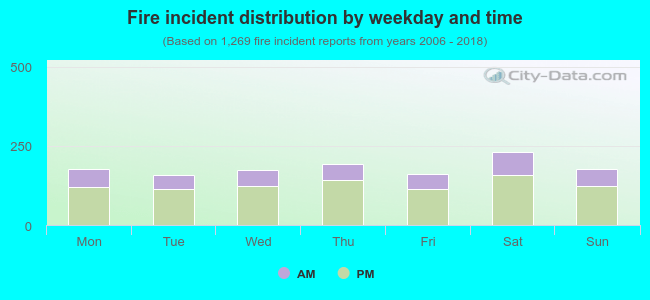 29.5% incidents where reported in the morning and 70.5% in the evening. The most fires (18.3%) took place on Saturday, and the least (12.5%) on Tuesday.
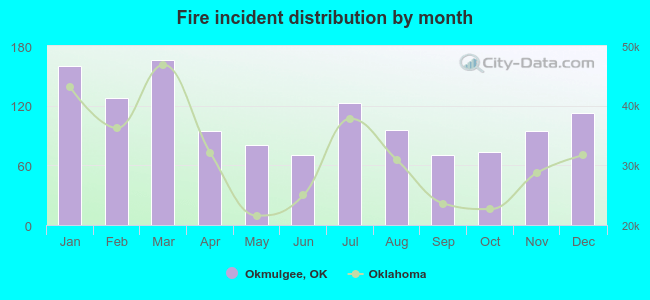 According to the 1,269 fires from years 2006 - 2018 most fires (13.1%) took place during March, and the least (5.5%) in June.
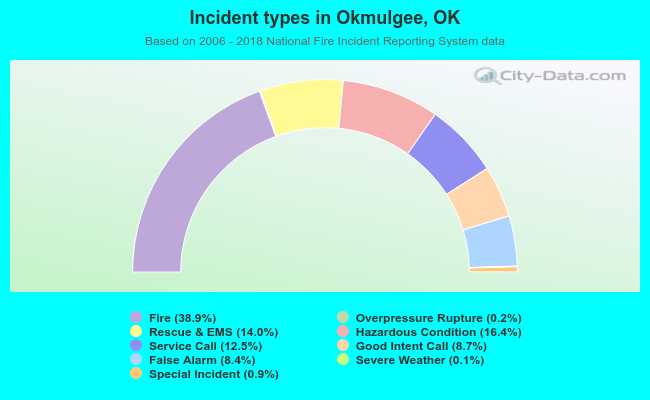 Out of all 3,259 cases reported during the years 2006 - 2018, the most belonged to the categories: Fire (38.9%), Hazardous Condition (16.4%), and Rescue & EMS (14.0%).
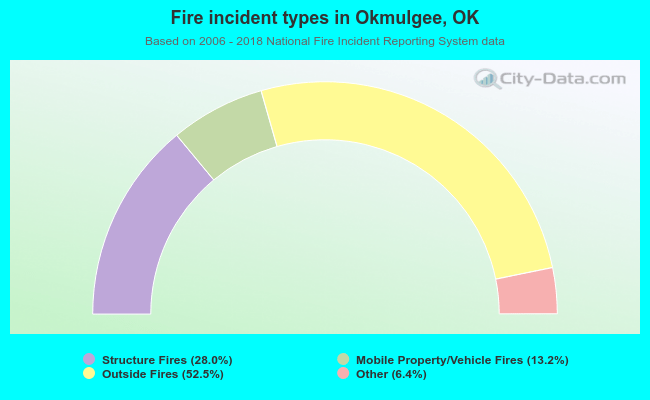 When looking into fire subcategories, the most incidents belonged to: Outside Fires (52.5%), and Structure Fires (28.0%).