Amherst: Fire Incidents, New Hampshire (NH)
Where are fire incidents reported in Amherst, NH
Something went wrong! Please refresh the page.
| Fire incidents reported | |
|---|---|
| Sreet name | Count |
| ROUTE 101A | 118 |
| BOSTON POST RD | 62 |
| ROUTE 101 | 48 |
| MERRIMACK RD | 38 |
| MACK HILL RD | 32 |
| PONEMAH RD | 28 |
| AMHERST ST | 24 |
| COUNTY RD | 22 |
| HICKORY DR | 22 |
| BABOOSIC LAKE RD | 20 |
| CHRISTIAN HILL RD | 18 |
| MANHATTAN DR | 16 |
| STORYBROOK LN | 14 |
| VETERANS RD | 14 |
| NATHAN LORD RD | 12 |
| OLD NASHUA RD | 12 |
| PONEMAH HILL RD | 12 |
| ROUTE 101-A | 12 |
| SEAVERNS BRIDGE RD | 12 |
| BLOODY BROOK RD | 10 |
| CHESTNUT HILL RD | 10 |
| COLUMBIA DR | 10 |
| CORDUROY RD | 10 |
| HORACE GREELEY RD | 10 |
| LYNDEBOROUGH RD | 10 |
| MILFORD RD | 10 |
| OLD MILFORD RD | 10 |
| THORTON'S FERRY II RD | 10 |
| AGLIPAY DR | 8 |
| BLUEBERRY HILL RD | 8 |
2003 - 2018 National Fire Incident Reporting System (NFIRS) incidents
- Incident types reported to NFIRS in Amherst, NH
- 83125.1%Hazardous Condition
- 59017.8%Fire
- 54716.5%False Alarm
- 52215.8%Rescue & EMS
- 44213.3%Service Call
- 35010.6%Good Intent Call
- 240.7%Severe Weather
- 60.2%Special Incident
- Fire incident types reported to NFIRS in Amherst, NH
- 32955.8%Structure Fires
- 17830.2%Outside Fires
- 6611.2%Mobile Property/Vehicle Fires
- 172.9%Other
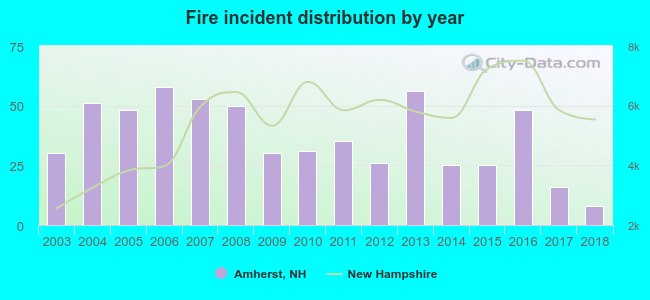 According to the data from the years 2003 - 2018 the average number of fires per year is 37. The highest number of reported fire incidents - 58 took place in 2006, and the least - 8 in 2018. The data has a decreasing trend.
The average number of yearly fire incidents per 10k residents in Amherst, NH compared to nearest cities:
(Note: Based on data for the last 3 years, including only cities with population 5,000 and above)
| Amherst: | 21.4 |
| Milford: | 47.2 |
| Merrimack: | 28.8 |
| Bedford: | 24.5 |
| Litchfield: | 33.5 |
| Hollis: | 26.0 |
| New Boston: | 67.0 |
| Nashua: | 30.6 |
| Hudson: | 59.1 |
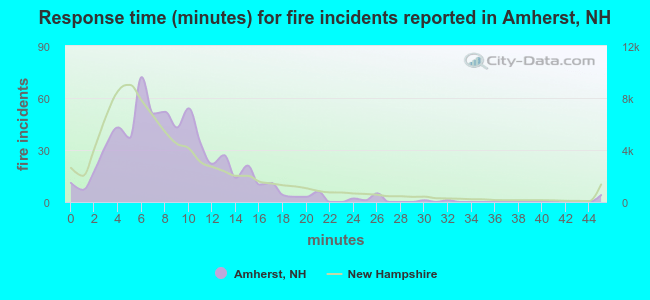 The median response time based on all reported fire incidents is 8 minutes. This is about the same as the New Hampshire median value.
The median response time in Amherst, NH compared to nearest cities:
(Note: Based on data for all years, including only cities with at least 500 fire incidents)
| Amherst: | 8 minutes |
| Milford: | 6 minutes |
| Merrimack: | 6 minutes |
| Bedford: | 7 minutes |
| Nashua: | 6 minutes |
| Hudson: | 6 minutes |
| Goffstown: | 6 minutes |
| Manchester: | 5 minutes |
| Londonderry: | 6 minutes |
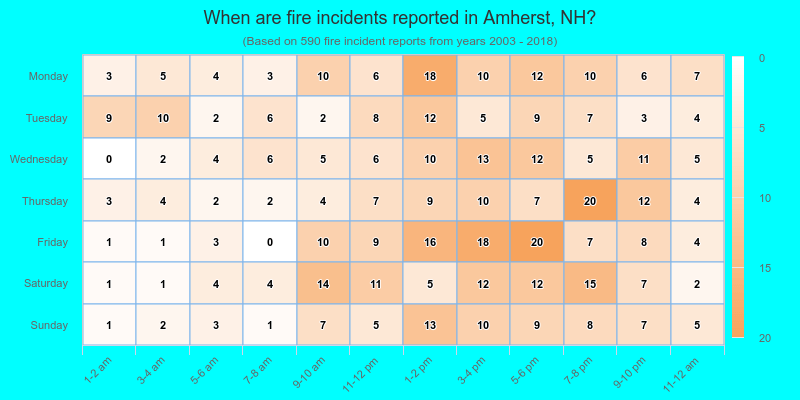
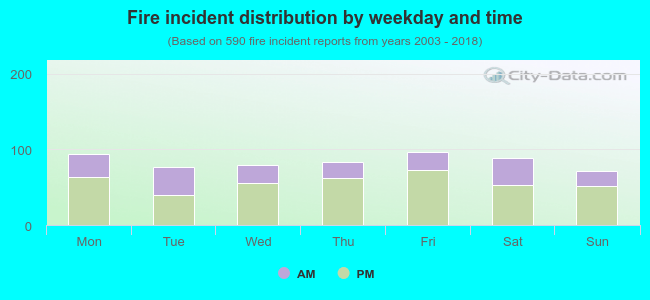 32.4% incidents where reported in the morning and 67.6% in the evening. The most fires (16.4%) took place on Friday, and the least (12.0%) on Sunday.
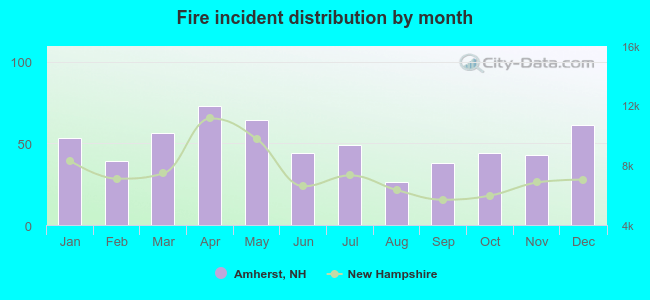 Based on the 590 fire incident reports from years 2003 - 2018 most fires (12.4%) took place during April, and the least (4.4%) in August.
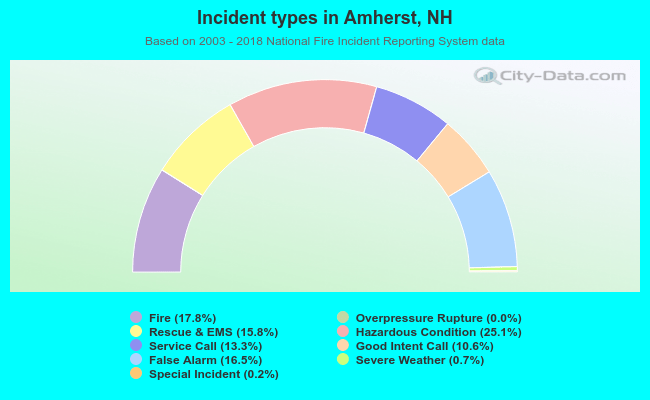 Out of all 3,313 cases reported during the years 2003 - 2018, the most belonged to the categories: Hazardous Condition (25.1%), Fire (17.8%), and False Alarm (16.5%).
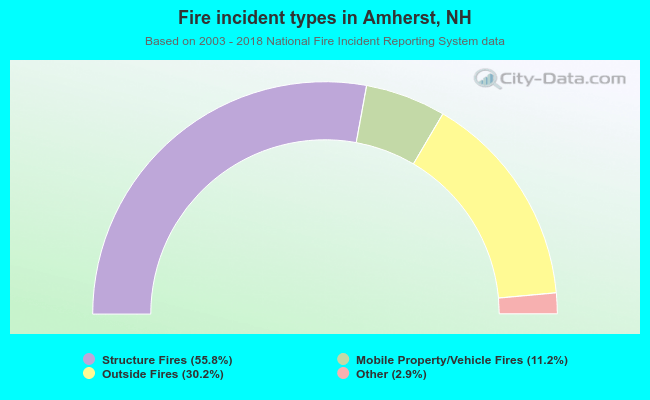 When looking into fire subcategories, the most reports belonged to: Structure Fires (55.8%), and Outside Fires (30.2%).