Hooksett: Fire Incidents, New Hampshire (NH)
Where are fire incidents reported in Hooksett, NH
Something went wrong! Please refresh the page.
| Fire incidents reported | |
|---|---|
| Sreet name | Count |
| HOOKSETT RD | 374 |
| HACKETT HILL RD | 124 |
| WHITEHALL RD | 110 |
| RIVER RD | 94 |
| HOOKSETT FIRE | 58 |
| LEHOUX DR | 54 |
| INTERSTATE 93 SOUTH | 50 |
| INTERSTATE 93 NORTH | 48 |
| WEST RIVER RD | 44 |
| PLEASANT ST | 42 |
| MAMMOTH RD | 38 |
| LONDONDERRY TPKE | 36 |
| MAIN ST | 26 |
| MERRIMACK ST | 26 |
| QUALITY DR | 26 |
| INDUSTRIAL PARK DR | 24 |
| HACKETT HILL ROAD | 22 |
| I 93 | 22 |
| LONDONDERRY | 22 |
| SMYTH RD | 22 |
| DALE RD | 20 |
| BENTON RD | 18 |
| GOFFSTOWN RD | 18 |
| GRANITE ST | 18 |
| JOHNS DR | 18 |
| MARTINS FERRY RD | 18 |
| SPRINGER RD | 18 |
| BICENTENNIAL DR | 16 |
| CHESTER TURNPIKE | 16 |
| EDGEWATER DR | 16 |
2002 - 2018 National Fire Incident Reporting System (NFIRS) incidents
- Incident types reported to NFIRS in Hooksett, NH
- 6,65648.0%Rescue & EMS
- 2,01114.5%False Alarm
- 1,54311.1%Hazardous Condition
- 1,44710.4%Service Call
- 1,2769.2%Fire
- 8436.1%Good Intent Call
- 340.2%Special Incident
- 260.2%Severe Weather
- 190.1%Overpressure Rupture
- Fire incident types reported to NFIRS in Hooksett, NH
- 54642.8%Structure Fires
- 48337.9%Outside Fires
- 20616.1%Mobile Property/Vehicle Fires
- 413.2%Other
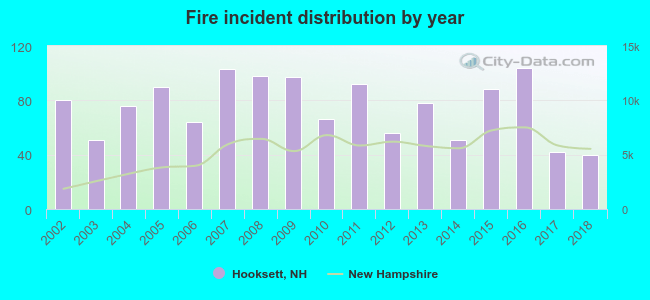 According to the data from the years 2002 - 2018 the average number of fires per year is 75. The highest number of fires - 104 took place in 2016, and the least - 40 in 2018. The data has a declining trend.
 The median response time based on all reported fire incidents is 8 minutes. This is close to the New Hampshire median value.
The median response time in Hooksett, NH compared to nearest cities:
(Note: Based on data for all years, including only cities with at least 500 fire incidents)
| Hooksett: | 8 minutes |
| Bow: | 8 minutes |
| Goffstown: | 6 minutes |
| Manchester: | 5 minutes |
| Concord: | 5 minutes |
| Epsom: | 10 minutes |
| Bedford: | 7 minutes |
| Weare: | 11 minutes |
| Hopkinton: | 9 minutes |
 According to the data from the years 2002 - 2018 the average number of fire-related yearly casualties is 1. The highest number of casualties - 4 took place in 2011, and the lowest - 0 in 2002. The data has a rising trend.
The average number of casualties per 1,000 fire incidents is 12. This indicator was the highest - 43 in 2011, and the lowest 0 in 2002. The trend for injuries per 1,000 fires is rising. Compared to the New Hampshire value the number of injuries per 1,000 incidents is about the same.
According to the data from the years 2002 - 2018 the average number of fire-related yearly casualties is 1. The highest number of casualties - 4 took place in 2011, and the lowest - 0 in 2002. The data has a rising trend.
The average number of casualties per 1,000 fire incidents is 12. This indicator was the highest - 43 in 2011, and the lowest 0 in 2002. The trend for injuries per 1,000 fires is rising. Compared to the New Hampshire value the number of injuries per 1,000 incidents is about the same.
 34.6% incidents where reported in the morning and 65.4% in the evening. The most fires (16.8%) took place on Friday, and the least (9.1%) on Wednesday.
 According to the 1,276 fires from years 2002 - 2018 most fires (13.6%) took place during May, and the least (5.4%) in February.
 Out of all 13,855 cases reported during the years 2002 - 2018, the most belonged to the categories: Rescue & EMS (48.0%), False Alarm (14.5%), and Hazardous Condition (11.1%).
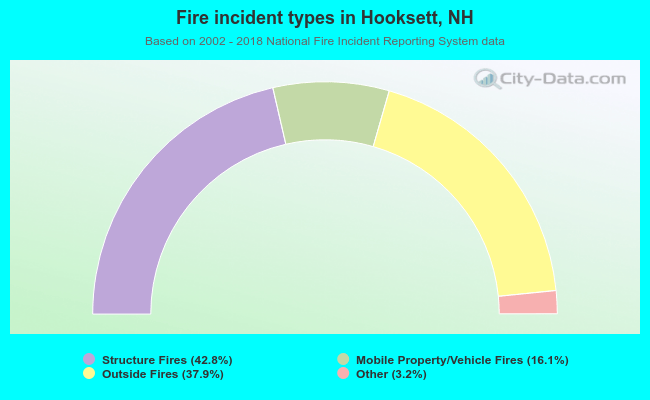 When looking into fire subcategories, the most reports belonged to: Structure Fires (42.8%), and Outside Fires (37.9%).