Weare: Fire Incidents, New Hampshire (NH)
Where are fire incidents reported in Weare, NH
Something went wrong! Please refresh the page.
| Fire incidents reported | |
|---|---|
| Sreet name | Count |
| SOUTH STARK HIGHWAY | 92 |
| CONCORD STAGE ROAD | 70 |
| RIVER ROAD | 64 |
| CLOUGH PARK ROAD | 36 |
| NORTH STARK HIGHWAY | 34 |
| DEERING CENTER ROAD | 26 |
| COLBY ROAD | 22 |
| DUSTIN TAVERN ROAD | 20 |
| EAST STREET | 20 |
| RESERVOIR DRIVE | 20 |
| BARNARD HILL ROAD | 18 |
| CONCORD STAGE RD | 18 |
| MERRILL ROAD | 18 |
| QUAKER STREET | 18 |
| EAST RD | 16 |
| HODGDON ROAD | 16 |
| DUSTIN TAVERN RD | 14 |
| HOIT MILL ROAD | 14 |
| MAPLEWOLD ROAD | 14 |
| MOUNTAIN ROAD | 12 |
| OAK HILL ROAD | 12 |
| OLD TOWN ROAD | 12 |
| RIVER RD | 12 |
| SUGAR HILL ROAD | 12 |
| WALKER HILL ROAD | 12 |
| ABIJAH BRIDGE ROAD | 10 |
| CENTER ROAD | 10 |
| HOLLY HILL FARM ROAD | 10 |
| MARTIN ROAD | 10 |
| MOUNT DEARBORN ROAD | 10 |
| Other | 63 |
2002 - 2018 National Fire Incident Reporting System (NFIRS) incidents
- Incident types reported to NFIRS in Weare, NH
- 2,66151.2%Rescue & EMS
- 81215.6%Hazardous Condition
- 73514.1%Fire
- 3957.6%Service Call
- 3326.4%False Alarm
- 2484.8%Good Intent Call
- 80.2%Overpressure Rupture
- 70.1%Special Incident
- Fire incident types reported to NFIRS in Weare, NH
- 39954.3%Structure Fires
- 22530.6%Outside Fires
- 8211.2%Mobile Property/Vehicle Fires
- 293.9%Other
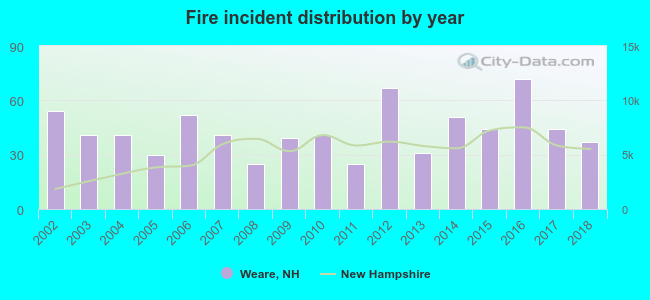 According to the data from the years 2002 - 2018 the average number of fire incidents per year is 43. The highest number of reported fires - 72 took place in 2016, and the least - 25 in 2008. The data has a declining trend.
The average number of yearly fire incidents per 10k residents in Weare, NH compared to nearest cities:
(Note: Based on data for the last 3 years, including only cities with population 5,000 and above)
| Weare: | 58.1 |
| New Boston: | 67.0 |
| Hopkinton: | 66.8 |
| Goffstown: | 31.5 |
| Bow: | 72.7 |
| Concord: | 41.9 |
| Bedford: | 24.5 |
| Pembroke: | 20.6 |
| Manchester: | 27.2 |
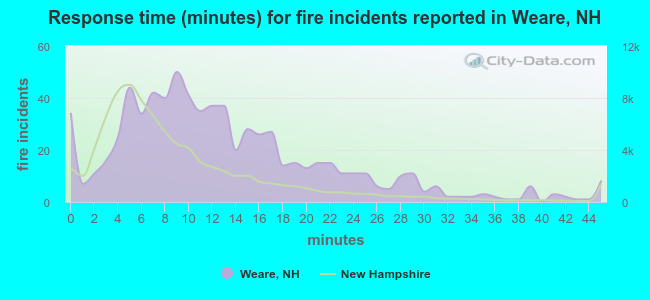 The median response time based on all reported fire incidents is 11 minutes. This is higher compared to the state median value.
The median response time in Weare, NH compared to nearest cities:
(Note: Based on data for all years, including only cities with at least 500 fire incidents)
| Weare: | 11 minutes |
| Hopkinton: | 9 minutes |
| Henniker: | 7 minutes |
| Goffstown: | 6 minutes |
| Bow: | 8 minutes |
| Concord: | 5 minutes |
| Hooksett: | 8 minutes |
| Bedford: | 7 minutes |
| Manchester: | 5 minutes |
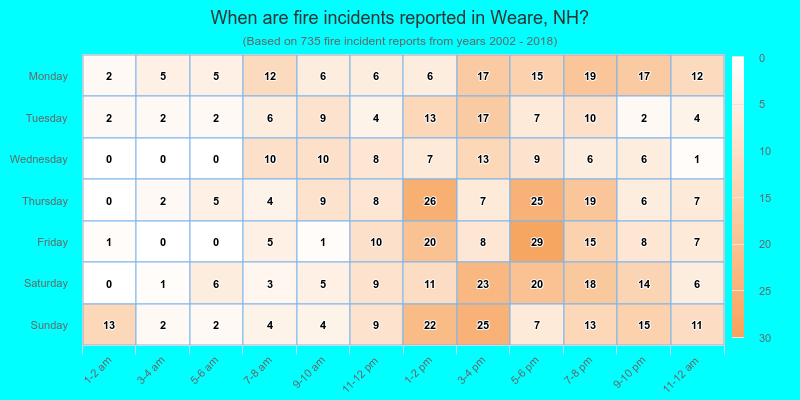
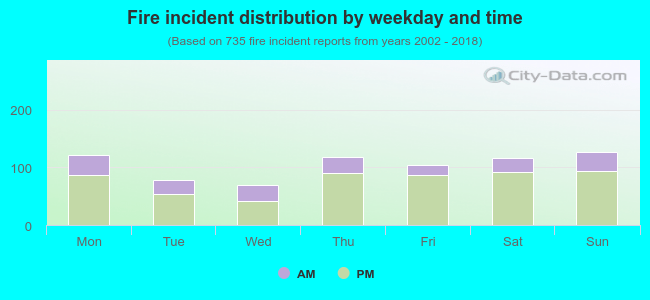 26.1% incidents where reported in the morning and 73.9% in the evening. The most fires (17.3%) took place on Sunday, and the least (9.5%) on Wednesday.
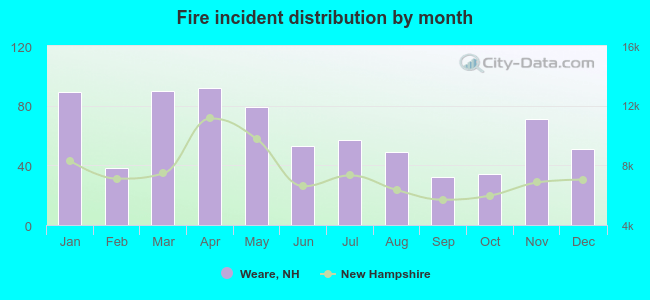 Based on the 735 fire incident reports from years 2002 - 2018 most fires (12.5%) took place during April, and the least (4.4%) in September.
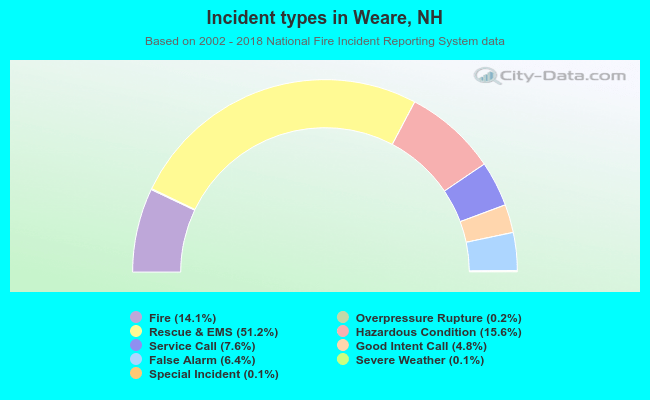 Out of all 5,201 cases reported during the years 2002 - 2018, the most belonged to the categories: Rescue & EMS (51.2%), Hazardous Condition (15.6%), and Fire (14.1%).
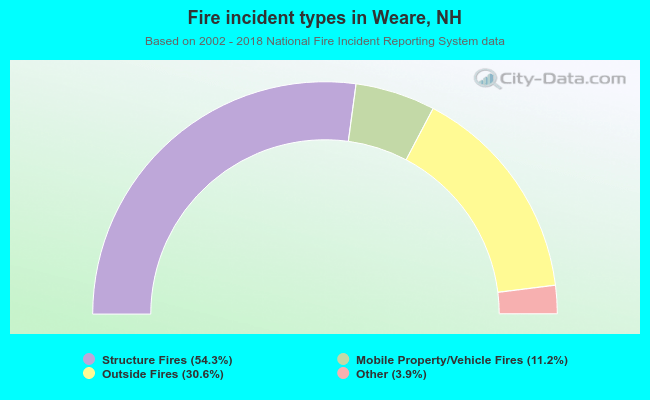 When looking into fire subcategories, the most incidents belonged to: Structure Fires (54.3%), and Outside Fires (30.6%).