Manchester: Fire Incidents, New Hampshire (NH)
Where are fire incidents reported in Manchester, NH
Something went wrong! Please refresh the page.
| Fire incidents reported | |
|---|---|
| Sreet name | Count |
| WILLOW ST | 384 |
| ELM ST | 314 |
| HANOVER ST | 126 |
| MAPLE ST | 118 |
| BEECH ST | 110 |
| LAKE AVE | 102 |
| 93 | 96 |
| EASTERN AVE | 96 |
| MAMMOTH RD | 96 |
| 293 | 94 |
| UNION ST | 94 |
| BELMONT ST | 82 |
| BROWN AVE | 82 |
| GOFFSTOWN RD | 82 |
| SECOND ST | 80 |
| BRIDGE ST | 74 |
| PINE ST | 74 |
| MERRIMACK ST | 70 |
| CANDIA RD | 66 |
| CHESTNUT ST | 64 |
| MAIN ST | 64 |
| VALLEY ST | 64 |
| SPRUCE ST | 62 |
| CEDAR ST | 60 |
| DOUGLAS ST | 60 |
| DUBUQUE ST | 60 |
| FRONT ST | 60 |
| BODWELL RD | 58 |
| HUSE RD | 58 |
| MANCHESTER ST | 58 |
| Other | 978 |
2003 - 2018 National Fire Incident Reporting System (NFIRS) incidents
- Incident types reported to NFIRS in Manchester, NH
- 74,73474.5%Rescue & EMS
- 8,0388.0%False Alarm
- 5,0685.1%Good Intent Call
- 4,3394.3%Hazardous Condition
- 3,9513.9%Service Call
- 3,8863.9%Fire
- 1390.1%Overpressure Rupture
- Fire incident types reported to NFIRS in Manchester, NH
- 1,73244.6%Outside Fires
- 1,46337.6%Structure Fires
- 49512.7%Mobile Property/Vehicle Fires
- 1965.0%Other
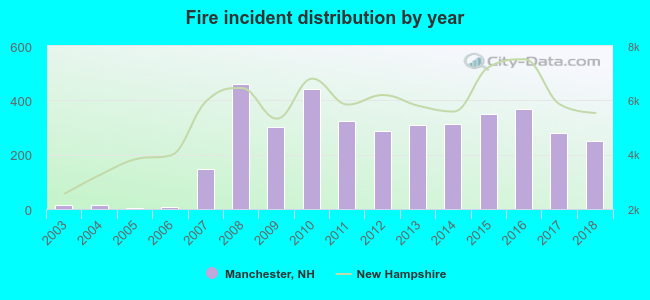 According to the data from the years 2003 - 2018 the average number of fires per year is 242. The highest number of fire incidents - 459 took place in 2008, and the least - 2 in 2005. The data has a rising trend.
The average number of yearly fire incidents per 10k residents in Manchester, NH compared to nearest cities:
(Note: Based on data for the last 3 years, including only cities with population 5,000 and above)
| Manchester: | 27.2 |
| Bedford: | 24.5 |
| Goffstown: | 31.5 |
| Merrimack: | 28.8 |
| Litchfield: | 33.5 |
| Derry: | 46.6 |
| Londonderry: | 72.8 |
| Bow: | 72.7 |
| Amherst: | 21.4 |
 The median response time based on all reported fire incidents is 5 minutes. This is lower than the New Hampshire median value.
The median response time in Manchester, NH compared to nearest cities:
(Note: Based on data for all years, including only cities with at least 500 fire incidents)
| Manchester: | 5 minutes |
| Bedford: | 7 minutes |
| Goffstown: | 6 minutes |
| Hooksett: | 8 minutes |
| Merrimack: | 6 minutes |
| Derry: | 5 minutes |
| Londonderry: | 6 minutes |
| Bow: | 8 minutes |
| Amherst: | 8 minutes |
 Based on the reports from the years 2003 - 2018 the average number of fire-related yearly deaths is 1. The highest number of reported deaths - 2 took place in 2011, and the lowest - 0 in 2003. The data has a constant trend.
The average number of fatalities per 1,000 fires is 2. This indicator was the highest - 7 in 2007, and the lowest 0 in 2003. The trend for fatalities per 1,000 fire incidents is constant. Compared to the New Hampshire value the number of deaths per 1,000 fire incidents is higher.
Based on the reports from the years 2003 - 2018 the average number of fire-related yearly deaths is 1. The highest number of reported deaths - 2 took place in 2011, and the lowest - 0 in 2003. The data has a constant trend.
The average number of fatalities per 1,000 fires is 2. This indicator was the highest - 7 in 2007, and the lowest 0 in 2003. The trend for fatalities per 1,000 fire incidents is constant. Compared to the New Hampshire value the number of deaths per 1,000 fire incidents is higher.
 According to the data from the years 2003 - 2018 the average number of fire-related yearly casualties is 6. The highest number of casualties - 21 took place in 2008, and the lowest - 0 in 2003. The data has a constant trend.
The average number of casualties per 1,000 fires is 16. This indicator was the highest - 50 in 2011, and the lowest 0 in 2003. The trend for casualties per 1,000 incidents is decreasing. Compared to the New Hampshire value the number of casualties per 1,000 incidents is much higher.
According to the data from the years 2003 - 2018 the average number of fire-related yearly casualties is 6. The highest number of casualties - 21 took place in 2008, and the lowest - 0 in 2003. The data has a constant trend.
The average number of casualties per 1,000 fires is 16. This indicator was the highest - 50 in 2011, and the lowest 0 in 2003. The trend for casualties per 1,000 incidents is decreasing. Compared to the New Hampshire value the number of casualties per 1,000 incidents is much higher.
 30.9% incidents where reported in the morning and 69.1% in the evening. The most fires (15.6%) took place on Monday, and the least (13.2%) on Tuesday.
 According to the 3,886 fires from years 2003 - 2018 most fires (13.3%) took place during April, and the least (5.1%) in February.
 Out of all 100,276 cases reported during the years 2003 - 2018, the most belonged to the categories: Rescue & EMS (74.5%), False Alarm (8.0%), and Good Intent Call (5.1%).
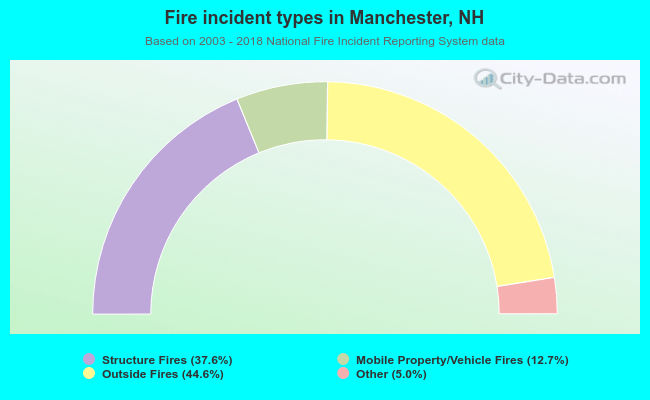 When looking into fire subcategories, the most reports belonged to: Outside Fires (44.6%), and Structure Fires (37.6%).