Hopewell Junction: Fire Incidents, New York (NY)
Where are fire incidents reported in Hopewell Junction, NY
Something went wrong! Please refresh the page.
|
| |||||||||||||||||||||||||||||||||||||||||||||||||||||||||||||||||||||||||||||||||||||||||||||||||||||||||||||
| Other | 156 | |||||||||||||||||||||||||||||||||||||||||||||||||||||||||||||||||||||||||||||||||||||||||||||||||||||||||||||
2003 - 2018 National Fire Incident Reporting System (NFIRS) incidents
- Incident types reported to NFIRS in Hopewell Junction, NY
- 6,42864.5%Rescue & EMS
- 1,05210.6%Hazardous Condition
- 9829.9%Fire
- 9139.2%False Alarm
- 2942.9%Good Intent Call
- 2752.8%Service Call
- 160.2%Severe Weather
- Fire incident types reported to NFIRS in Hopewell Junction, NY
- 55556.5%Structure Fires
- 23724.1%Outside Fires
- 18018.3%Mobile Property/Vehicle Fires
- 101.0%Other
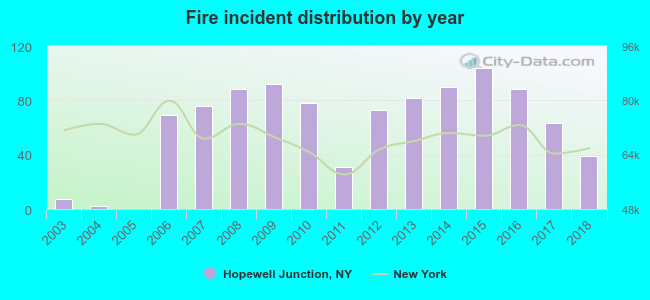 Based on the data from the years 2003 - 2018 the average number of fires per year is 61. The highest number of fire incidents - 104 took place in 2015, and the least - 0 in 2005. The data has an increasing trend.
 The median response time based on all reported fire incidents is 9 minutes. This is much higher than the state median value.
The median response time in Hopewell Junction, NY compared to nearest cities:
(Note: Based on data for all years, including only cities with at least 500 fire incidents)
| Hopewell Junction: | 9 minutes |
| Wappingers Falls: | 6 minutes |
| Fishkill: | 5 minutes |
| Beacon: | 3 minutes |
| Poughkeepsie: | 5 minutes |
| Pleasant Valley: | 7 minutes |
| Newburgh: | 3 minutes |
| Patterson: | 9 minutes |
| New Windsor: | 7 minutes |
 28.1% incidents where reported in the morning and 71.9% in the evening. The most fires (16.6%) took place on Saturday, and the least (12.8%) on Friday.
 Based on the 982 fires from years 2003 - 2018 most fires (11.1%) took place during April, and the least (4.6%) in September.
 Out of all 9,967 cases reported during the years 2003 - 2018, the most belonged to the categories: Rescue & EMS (64.5%), Hazardous Condition (10.6%), and Fire (9.9%).
 When looking into fire subcategories, the most reports belonged to: Structure Fires (56.5%), and Outside Fires (24.1%).