New Windsor: Fire Incidents, New York (NY)
Where are fire incidents reported in New Windsor, NY
Something went wrong! Please refresh the page.
| Fire incidents reported | |
|---|---|
| Sreet name | Count |
| WINDSOR HWY | 118 |
| BLOOMING GROVE TPKE | 108 |
| UNION AVE | 92 |
| VAILS GATE HEIGHTS DR | 84 |
| TEMPLE HILL RD | 80 |
| LITTLE BRITAIN RD | 62 |
| WALSH AVE | 54 |
| ROUTE 94 | 50 |
| ROUTE 9W | 50 |
| ROUTE 32 | 46 |
| QUASSAICK AVE | 38 |
| MOUNT AIRY RD | 36 |
| RILEY RD | 30 |
| NY STATE THRUWAY | 28 |
| OAKWOOD TER | 26 |
| JACKSON AVE | 24 |
| BETHLEHEM RD | 22 |
| OLD FORGE HILL RD | 20 |
| HUDSON DR | 18 |
| RIVER RD | 18 |
| TOLEMAN RD | 18 |
| BEATTIE RD | 16 |
| CEDAR AVE | 16 |
| FIRST ST | 16 |
| FORGE HILL RD | 16 |
| HARTH DR | 16 |
| LAKE RD | 16 |
| STATION RD | 16 |
| BULL RD | 14 |
| INDEPENDENCE DR | 14 |
2002 - 2018 National Fire Incident Reporting System (NFIRS) incidents
- Incident types reported to NFIRS in New Windsor, NY
- 1,86830.1%Hazardous Condition
- 1,62826.2%False Alarm
- 1,11618.0%Fire
- 5568.9%Good Intent Call
- 5558.9%Service Call
- 4717.6%Rescue & EMS
- 100.2%Overpressure Rupture
- 70.1%Severe Weather
- Fire incident types reported to NFIRS in New Windsor, NY
- 70963.5%Structure Fires
- 25022.4%Outside Fires
- 11710.5%Mobile Property/Vehicle Fires
- 403.6%Other
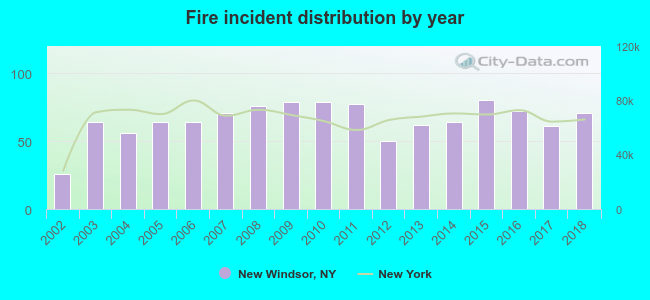 According to the data from the years 2002 - 2018 the average number of fire incidents per year is 66. The highest number of reported fire incidents - 80 took place in 2015, and the least - 26 in 2002. The data has a growing trend.
The average number of yearly fire incidents per 10k residents in New Windsor, NY compared to nearest cities:
(Note: Based on data for the last 3 years, including only cities with population 5,000 and above)
| New Windsor: | 76.2 |
| Newburgh: | 65.5 |
| Cornwall: | 7.4 |
| Beacon: | 38.4 |
| Philipstown: | 2.1 |
| Washingtonville: | 29.9 |
| Blooming Grove: | 4.8 |
| Walden: | 23.8 |
| Wappingers Falls: | 152.6 |
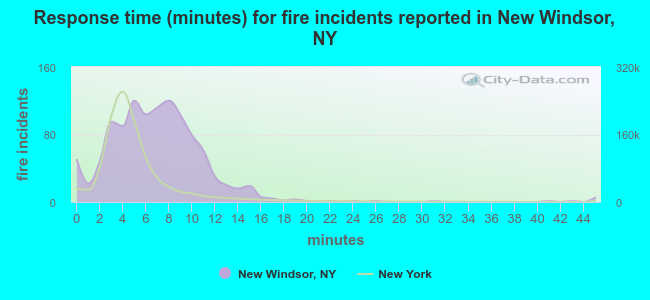 The median response time based on all reported fire incidents is 7 minutes. This is higher compared to the state median value.
The median response time in New Windsor, NY compared to nearest cities:
(Note: Based on data for all years, including only cities with at least 500 fire incidents)
| New Windsor: | 7 minutes |
| Newburgh: | 3 minutes |
| Beacon: | 3 minutes |
| Fishkill: | 5 minutes |
| Walden: | 5 minutes |
| Wappingers Falls: | 6 minutes |
| Montgomery: | 6 minutes |
| Putnam Valley: | 8 minutes |
| Monroe: | 2 minutes |
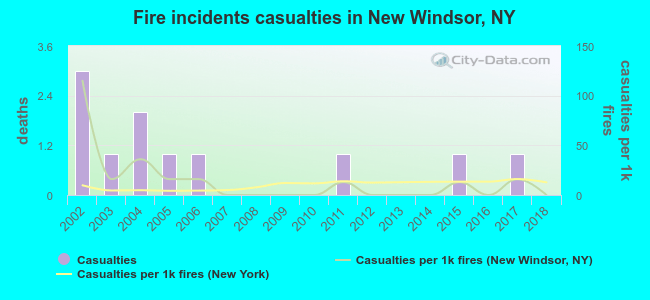 According to the data from the years 2002 - 2018 the average number of fire-related casualties per year is 1. The highest number of injuries - 3 took place in 2002, and the lowest - 0 in 2007. The data has a declining trend.
The average number of injuries per 1,000 fire incidents is 14. This indicator was the highest - 115 in 2002, and the lowest 0 in 2007. The trend for casualties per 1,000 fires is declining. Compared to the New York value the number of injuries per 1,000 fire incidents is similar.
According to the data from the years 2002 - 2018 the average number of fire-related casualties per year is 1. The highest number of injuries - 3 took place in 2002, and the lowest - 0 in 2007. The data has a declining trend.
The average number of injuries per 1,000 fire incidents is 14. This indicator was the highest - 115 in 2002, and the lowest 0 in 2007. The trend for casualties per 1,000 fires is declining. Compared to the New York value the number of injuries per 1,000 fire incidents is similar.Casualties per 1,000 incidents in New Windsor, NY compared to nearest cities:
(Note: Based on data for all years, including only cities with at least 500 fire incidents)
| New Windsor: | 9.9 |
| Newburgh: | 1.0 |
| Beacon: | 5.5 |
| Fishkill: | 0.0 |
| Walden: | 6.4 |
| Wappingers Falls: | 4.4 |
| Montgomery: | 0.0 |
| Putnam Valley: | 1.6 |
| Monroe: | 7.2 |
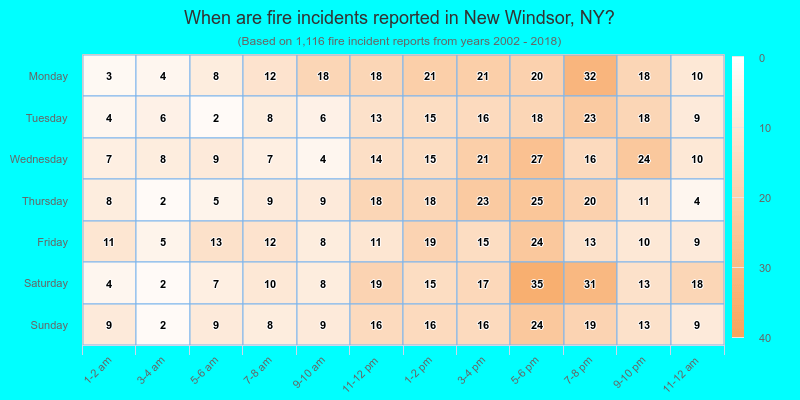
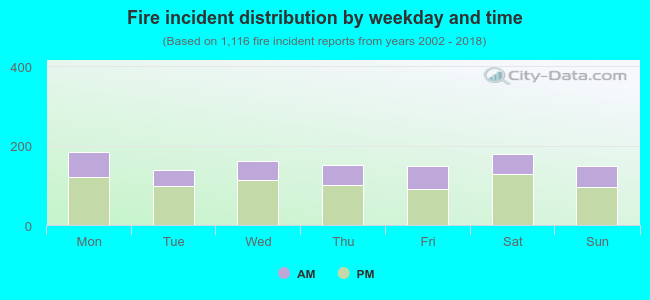 32.7% incidents where reported in the morning and 67.3% in the evening. The most fires (16.6%) took place on Monday, and the least (12.4%) on Tuesday.
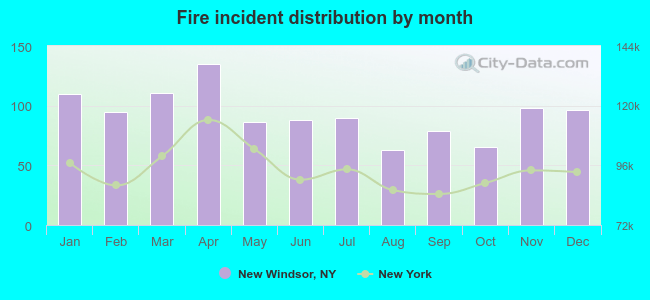 Based on the 1,116 fires from years 2002 - 2018 most fires (12.1%) took place during April, and the least (5.6%) in August.
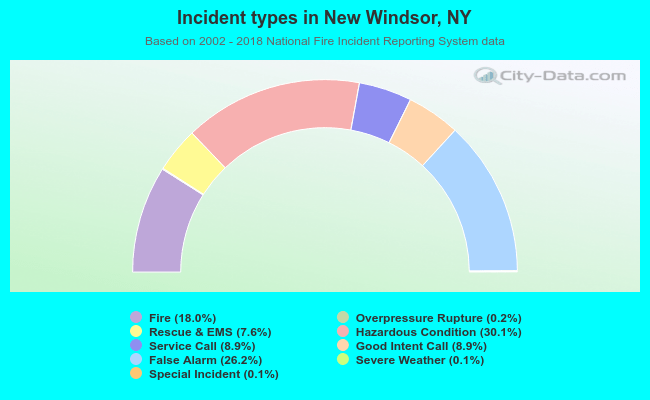 Out of all 6,215 cases reported during the years 2002 - 2018, the most belonged to the categories: Hazardous Condition (30.1%), False Alarm (26.2%), and Fire (18.0%).
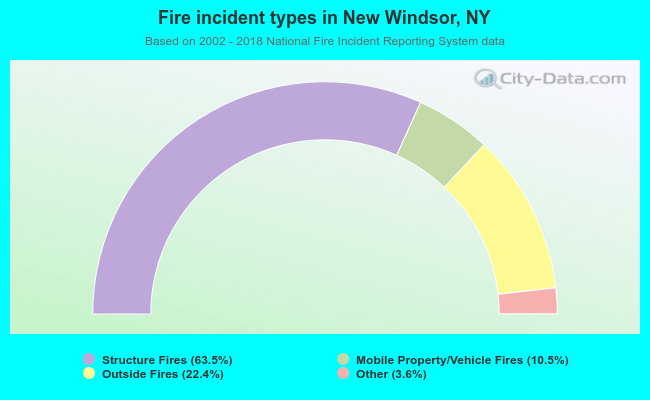 When looking into fire subcategories, the most reports belonged to: Structure Fires (63.5%), and Outside Fires (22.4%).