Newburgh: Fire Incidents, New York (NY)
Where are fire incidents reported in Newburgh, NY
Something went wrong! Please refresh the page.
| Fire incidents reported | |
|---|---|
| Sreet name | Count |
| BROADWAY | 434 |
| NEW YORK STATE ROUTE 300 | 226 |
| LIBERTY ST | 138 |
| GRAND ST | 134 |
| INTERSTATE 84 | 120 |
| SOUTH PLANK ROAD | 108 |
| LANDER ST | 102 |
| WASHINGTON ST | 90 |
| FIRST ST | 76 |
| DUBOIS ST | 74 |
| LIBERTY ST | 74 |
| ROUTE 9W | 72 |
| ROUTE 17K HWY | 68 |
| LAKESIDE ROAD | 66 |
| NY STATE THRUWAY | 64 |
| RT 300 | 64 |
| NEW YORK STATE THRUWAY 87 | 62 |
| N PLANK RD | 60 |
| WILLIAM ST | 60 |
| JOHNSTON ST | 58 |
| SOUTH PLANK RD | 56 |
| THIRD ST | 56 |
| CHAMBERS ST | 52 |
| SOUTH ST | 52 |
| FULLERTON AV | 50 |
| MEADOW HILL RD | 48 |
| NEW YORK STATE ROUTE 17K | 46 |
| WASHINGTON ST | 46 |
| DUPONT AV | 44 |
| RENWICK ST | 44 |
| Other | 1,377 |
2003 - 2018 National Fire Incident Reporting System (NFIRS) incidents
- Incident types reported to NFIRS in Newburgh, NY
- 11,26734.3%Hazardous Condition
- 6,29019.2%Service Call
- 5,46216.6%False Alarm
- 4,02112.2%Fire
- 3,47210.6%Rescue & EMS
- 1,1423.5%Good Intent Call
- 1,0133.1%Special Incident
- 1480.5%Severe Weather
- Fire incident types reported to NFIRS in Newburgh, NY
- 1,68742.0%Structure Fires
- 1,12528.0%Outside Fires
- 74918.6%Mobile Property/Vehicle Fires
- 46011.4%Other
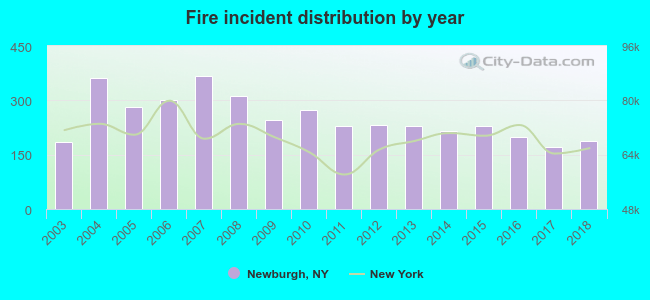 According to the data from the years 2003 - 2018 the average number of fire incidents per year is 251. The highest number of fire incidents - 366 took place in 2007, and the least - 170 in 2017. The data has a growing trend.
The average number of yearly fire incidents per 10k residents in Newburgh, NY compared to nearest cities:
(Note: Based on data for the last 3 years, including only cities with population 5,000 and above)
| Newburgh: | 65.5 |
| New Windsor: | 76.2 |
| Beacon: | 38.4 |
| Cornwall: | 7.4 |
| Philipstown: | 2.1 |
| Wappingers Falls: | 152.6 |
| Wappinger: | 5.2 |
| Washingtonville: | 29.9 |
| Walden: | 23.8 |
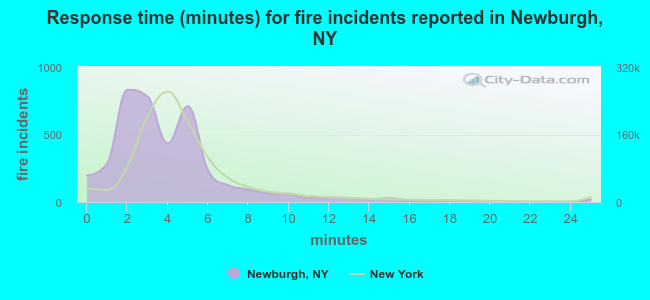 The median response time based on all reported fire incidents is 3 minutes. This is lower compared to the New York median value.
The median response time in Newburgh, NY compared to nearest cities:
(Note: Based on data for all years, including only cities with at least 500 fire incidents)
| Newburgh: | 3 minutes |
| New Windsor: | 7 minutes |
| Beacon: | 3 minutes |
| Fishkill: | 5 minutes |
| Wappingers Falls: | 6 minutes |
| Walden: | 5 minutes |
| Montgomery: | 6 minutes |
| Putnam Valley: | 8 minutes |
| Hopewell Junction: | 9 minutes |
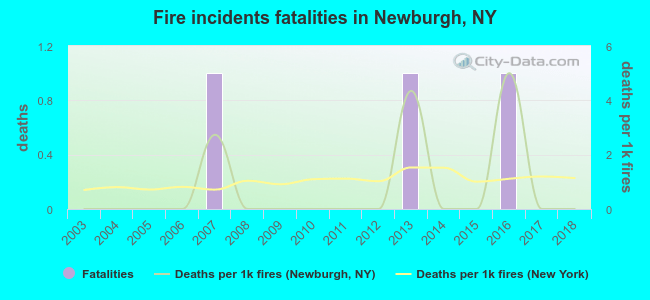 According to the data from the years 2003 - 2018 the average number of fire-related yearly deaths is 0. The highest number of deaths - 1 took place in 2007, and the lowest - 0 in 2003. The data has a constant trend.
The average number of fatalities per 1,000 fire incidents is 1. This indicator was the highest - 5 in 2016, and the lowest 0 in 2003. The trend for deaths per 1,000 incidents is constant. Compared to the New York value the number of fatalities per 1,000 fires is lower.
According to the data from the years 2003 - 2018 the average number of fire-related yearly deaths is 0. The highest number of deaths - 1 took place in 2007, and the lowest - 0 in 2003. The data has a constant trend.
The average number of fatalities per 1,000 fire incidents is 1. This indicator was the highest - 5 in 2016, and the lowest 0 in 2003. The trend for deaths per 1,000 incidents is constant. Compared to the New York value the number of fatalities per 1,000 fires is lower.Deaths per 1,000 incidents in Newburgh, NY compared to nearest cities:
(Note: Based on data for all years, including only cities with at least 2,500 fire incidents)
| Newburgh: | 0.7 |
| Poughkeepsie: | 1.1 |
| Monroe: | 0.7 |
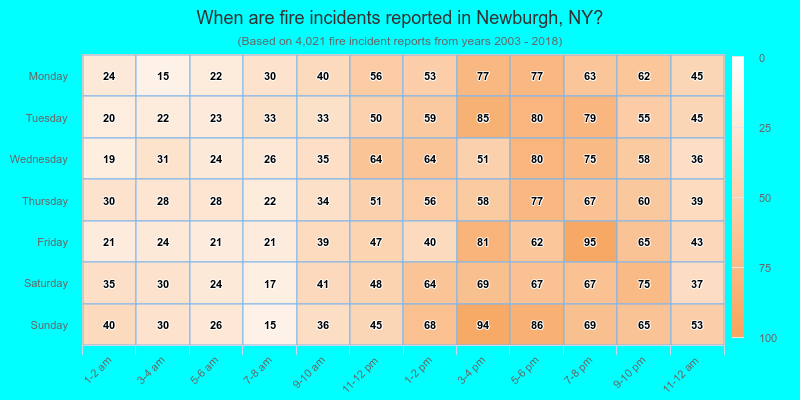
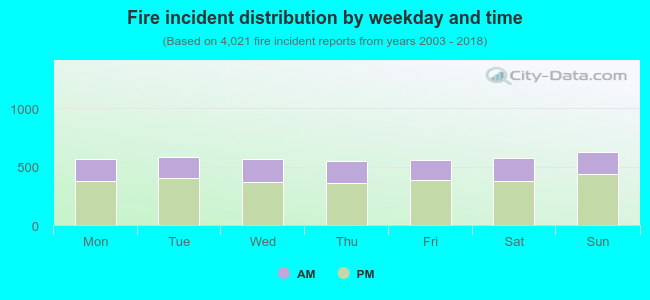 32.8% incidents where reported in the morning and 67.2% in the evening. The most fires (15.6%) took place on Sunday, and the least (13.7%) on Thursday.
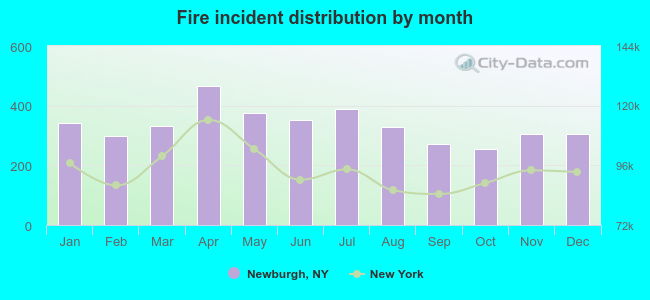 Based on the 4,021 incident reports from years 2003 - 2018 most fires (11.6%) took place during April, and the least (6.3%) in October.
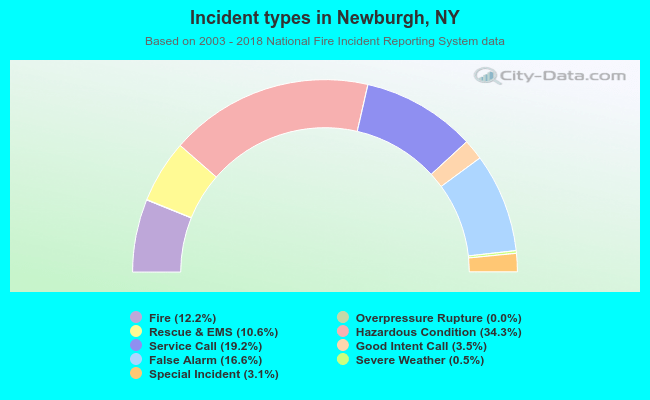 Out of all 32,831 cases reported during the years 2003 - 2018, the most belonged to the categories: Hazardous Condition (34.3%), Service Call (19.2%), and False Alarm (16.6%).
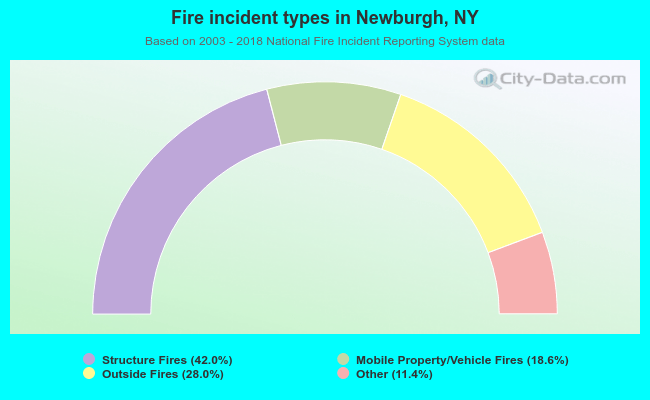 When looking into fire subcategories, the most incidents belonged to: Structure Fires (42.0%), and Outside Fires (28.0%).