Irvington: Fire Incidents, New York (NY)
Where are fire incidents reported in Irvington, NY
Something went wrong! Please refresh the page.
|
| |||||||||||||||||||||||||||||||||||||||||||||||||||||||||||||||||||||||||||||||||||||||||||||||||||||||||||||
2002 - 2018 National Fire Incident Reporting System (NFIRS) incidents
- Incident types reported to NFIRS in Irvington, NY
- 1,09841.3%False Alarm
- 79029.7%Hazardous Condition
- 2599.7%Fire
- 2138.0%Good Intent Call
- 1816.8%Rescue & EMS
- 1053.9%Service Call
- 70.3%Overpressure Rupture
- 40.2%Special Incident
- Fire incident types reported to NFIRS in Irvington, NY
- 16061.8%Structure Fires
- 6424.7%Outside Fires
- 3212.4%Mobile Property/Vehicle Fires
- 31.2%Other
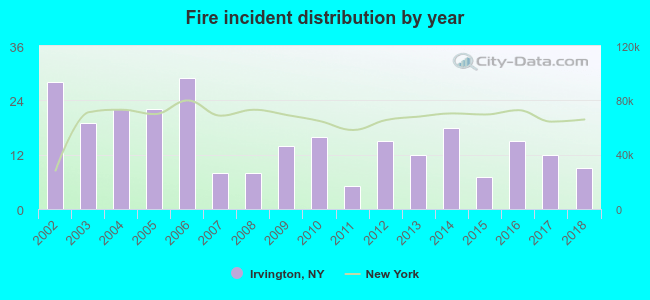 According to the data from the years 2002 - 2018 the average number of fire incidents per year is 15. The highest number of fires - 29 took place in 2006, and the least - 5 in 2011. The data has a declining trend.
The average number of yearly fire incidents per 10k residents in Irvington, NY compared to nearest cities:
(Note: Based on data for the last 3 years, including only cities with population 5,000 and above)
| Irvington: | 18.2 |
| Dobbs Ferry: | 33.6 |
| Greenburgh: | 6.7 |
| Tarrytown: | 8.4 |
| Hartsdale: | 102.7 |
| Sleepy Hollow: | 3.3 |
| Tappan: | 32.3 |
| Nyack: | 3.8 |
| Scarsdale: | 26.9 |
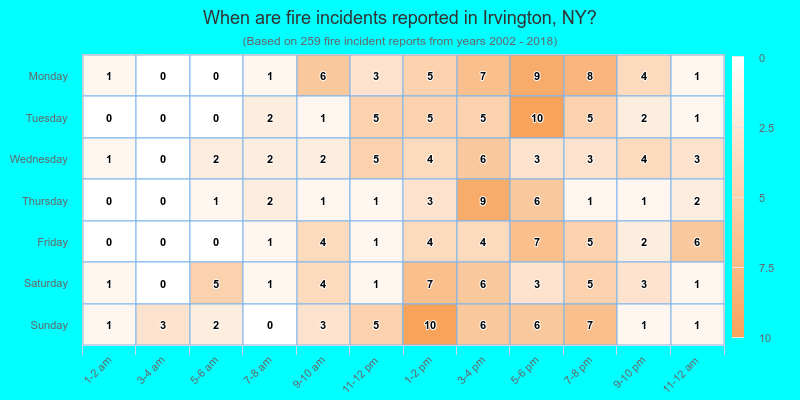
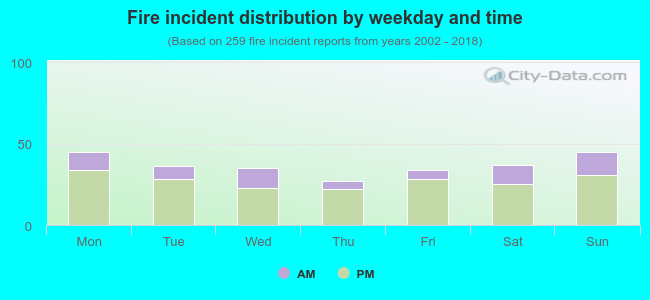 26.3% incidents where reported in the morning and 73.7% in the evening. The most fires (17.4%) took place on Monday, and the least (10.4%) on Thursday.
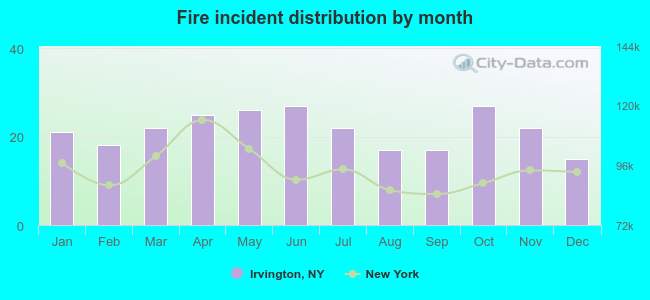 Based on the 259 fire incidents from years 2002 - 2018 most fires (10.4%) took place during June, and the least (5.8%) in December.
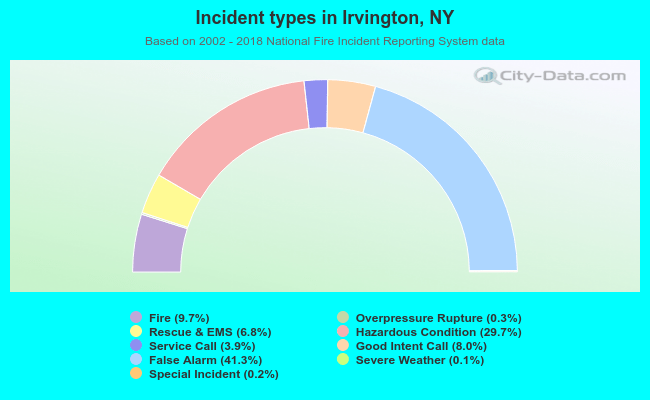 Out of all 2,659 cases reported during the years 2002 - 2018, the most belonged to the categories: False Alarm (41.3%), Hazardous Condition (29.7%), and Fire (9.7%).
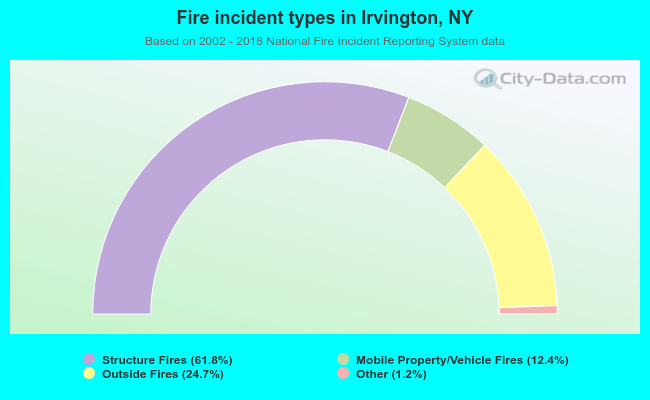 When looking into fire subcategories, the most reports belonged to: Structure Fires (61.8%), and Outside Fires (24.7%).