Greenburgh: Fire Incidents, New York (NY)
Where are fire incidents reported in Greenburgh, NY
Something went wrong! Please refresh the page.
| Fire incidents reported | |
|---|---|
| Sreet name | Count |
| CENTRAL AVE | 296 |
| HARTSDALE AVE | 62 |
| SPRAIN BROOK PARKWAY | 44 |
| SPRAIN VALLEY RD | 42 |
| SPRAIN BROOK PKY | 38 |
| UNDERHILL RD | 38 |
| GLENDALE RD | 34 |
| OLD ARMY RD | 34 |
| FORT HILL RD | 26 |
| ARDSLEY RD | 24 |
| OLD COLONY RD | 24 |
| FERNDALE RD | 20 |
| WALBROOKE RD | 18 |
| WHITE OAK LN | 18 |
| EDGEMONT RD | 16 |
| DELHI RD | 14 |
| JACKSON AVE | 14 |
| JACKSON AVE | 14 |
| ROBIN HILL RD | 14 |
| SEELY PL | 14 |
| CHEDWORTH RD | 12 |
| CLUB WAY | 12 |
| DROMORE RD | 12 |
| HEALY AVE | 12 |
| LONGVIEW DR | 12 |
| OVERTON RD | 12 |
| BRETTON RD | 10 |
| CHERRY LN | 10 |
| CLAYTON RD | 10 |
| EVANDALE RD | 10 |
2006 - 2018 National Fire Incident Reporting System (NFIRS) incidents
- Incident types reported to NFIRS in Greenburgh, NY
- 1,77527.3%Rescue & EMS
- 1,53223.6%Hazardous Condition
- 1,26219.4%False Alarm
- 75011.5%Fire
- 66510.2%Service Call
- 4737.3%Good Intent Call
- 180.3%Overpressure Rupture
- 170.3%Special Incident
- 80.1%Severe Weather
- Fire incident types reported to NFIRS in Greenburgh, NY
- 54172.1%Structure Fires
- 9612.8%Mobile Property/Vehicle Fires
- 8911.9%Outside Fires
- 243.2%Other
 According to the data from the years 2006 - 2018 the average number of fires per year is 58. The highest number of reported fires - 72 took place in 2015, and the least - 43 in 2011. The data has a decreasing trend.
The average number of yearly fire incidents per 10k residents in Greenburgh, NY compared to nearest cities:
(Note: Based on data for the last 3 years, including only cities with population 5,000 and above)
| Greenburgh: | 6.7 |
| Hartsdale: | 102.7 |
| Irvington: | 18.2 |
| Dobbs Ferry: | 33.6 |
| Tarrytown: | 8.4 |
| Scarsdale: | 26.9 |
| White Plains: | 29.4 |
| Sleepy Hollow: | 3.3 |
| Eastchester: | 27.6 |
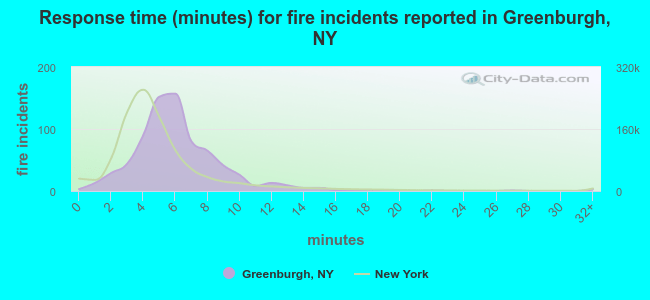 The median response time based on all reported fire incidents is 6 minutes. This is higher than the state median value.
The median response time in Greenburgh, NY compared to nearest cities:
(Note: Based on data for all years, including only cities with at least 500 fire incidents)
| Greenburgh: | 6 minutes |
| Hartsdale: | 4 minutes |
| Elmsford: | 5 minutes |
| Dobbs Ferry: | 3 minutes |
| Scarsdale: | 4 minutes |
| White Plains: | 4 minutes |
| Eastchester: | 5 minutes |
| Orangeburg: | 3 minutes |
| Yonkers: | 5 minutes |
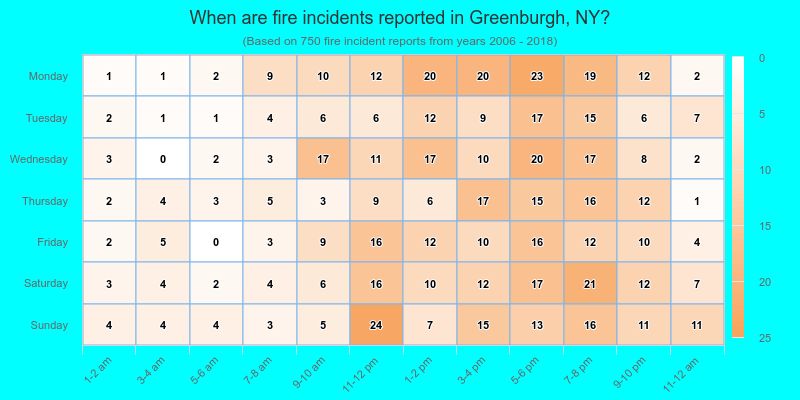
 30.8% incidents where reported in the morning and 69.2% in the evening. The most fires (17.5%) took place on Monday, and the least (11.5%) on Tuesday.
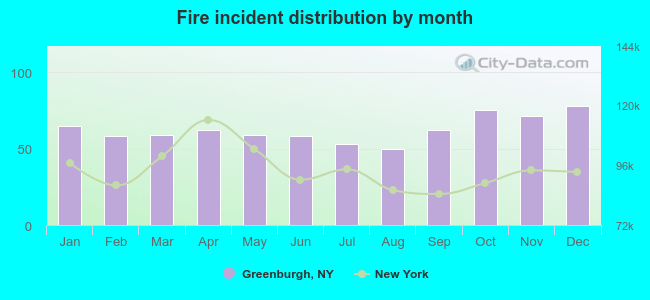 Based on the 750 incident reports from years 2006 - 2018 most fires (10.4%) took place during December, and the least (6.7%) in August.
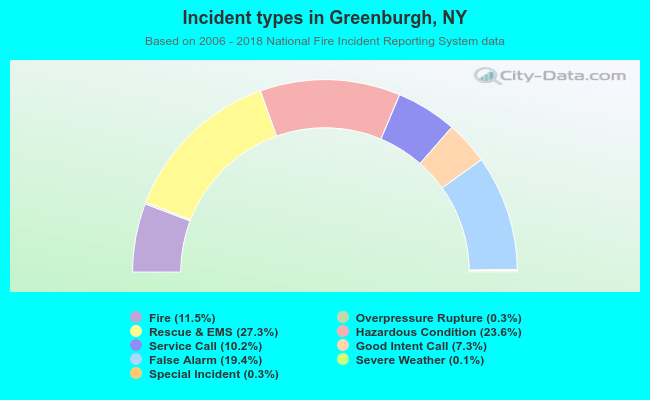 Out of all 6,500 cases reported during the years 2006 - 2018, the most belonged to the categories: Rescue & EMS (27.3%), Hazardous Condition (23.6%), and False Alarm (19.4%).
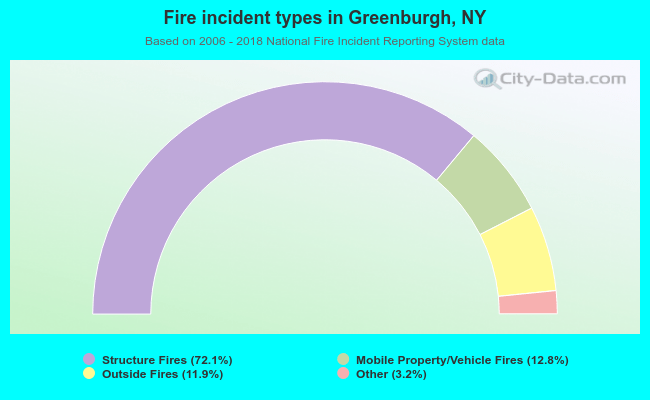 When looking into fire subcategories, the most reports belonged to: Structure Fires (72.1%), and Mobile Property/Vehicle Fires (12.8%).