Waukee: Fire Incidents, Iowa (IA)
Where are fire incidents reported in Waukee, IA
Something went wrong! Please refresh the page.
|
| |||||||||||||||||||||||||||||||||||||||||||||||||||||||||||||||||||||||||||||||||||||||||||||||||||||||||||||
2002 - 2017 National Fire Incident Reporting System (NFIRS) incidents
- Incident types reported to NFIRS in Waukee, IA
- 2,64755.0%Rescue & EMS
- 59612.4%False Alarm
- 4369.1%Fire
- 3978.2%Service Call
- 3256.8%Good Intent Call
- 2645.5%Hazardous Condition
- 711.5%Special Incident
- 661.4%Overpressure Rupture
- 120.2%Severe Weather
- Fire incident types reported to NFIRS in Waukee, IA
- 20847.7%Structure Fires
- 13831.7%Outside Fires
- 6514.9%Mobile Property/Vehicle Fires
- 255.7%Other
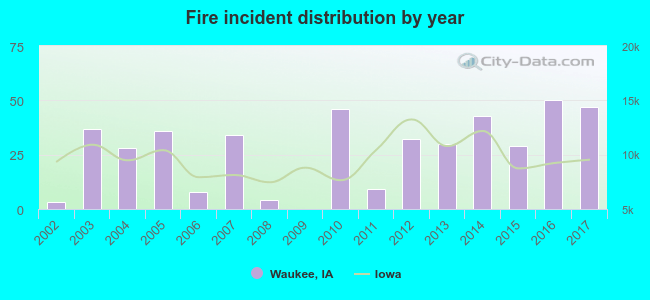 According to the data from the years 2002 - 2017 the average number of fire incidents per year is 27. The highest number of reported fire incidents - 50 took place in 2016, and the least - 0 in 2009. The data has a growing trend.
The average number of yearly fire incidents per 10k residents in Waukee, IA compared to nearest cities:
(Note: Based on data for the last 3 years, including only cities with population 5,000 and above)
| Waukee: | 27.4 |
| Clive: | 16.4 |
| West Des Moines: | 13.6 |
| Grimes: | 20.9 |
| Urbandale: | 10.8 |
| Johnston: | 21.4 |
| Des Moines: | 20.0 |
| Norwalk: | 2.0 |
| Ankeny: | 1.4 |
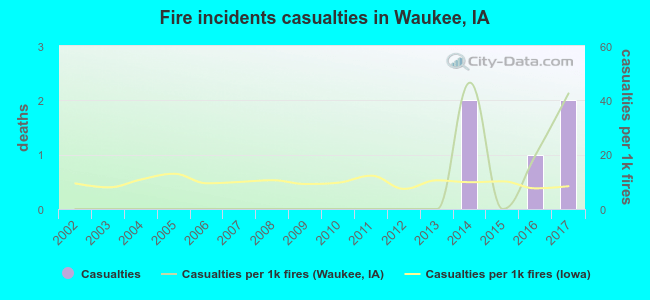 Based on the data from the years 2002 - 2017 the average number of fire-related casualties per year is 0. The highest number of casualties - 2 took place in 2014, and the lowest - 0 in 2002. The data has a rising trend.
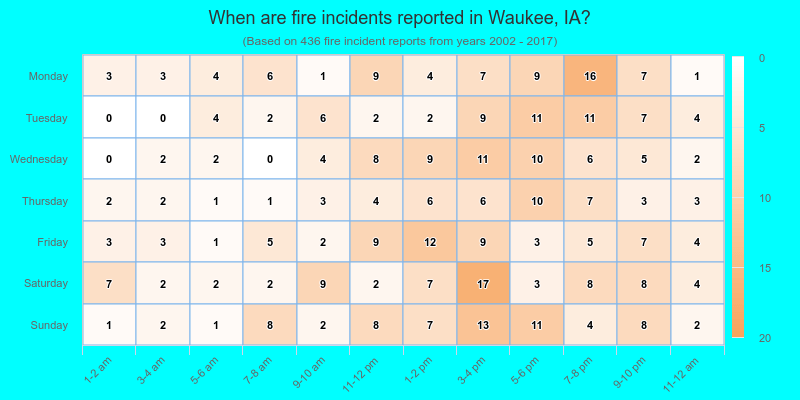
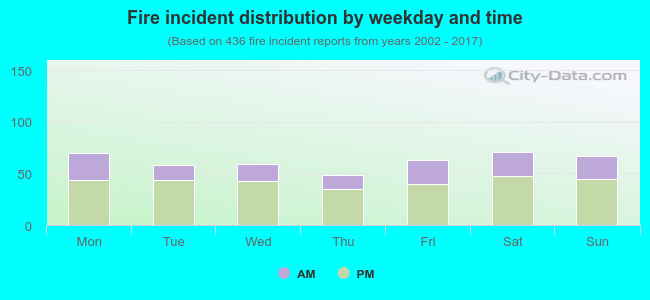 31.7% incidents where reported in the morning and 68.3% in the evening. The most fires (16.3%) took place on Saturday, and the least (11.0%) on Thursday.
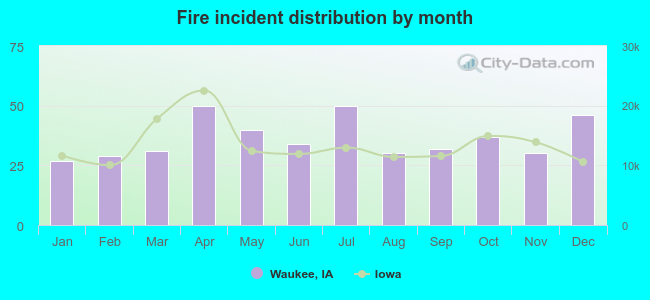 Based on the 436 fires from years 2002 - 2017 most fires (11.5%) took place during April, and the least (6.2%) in January.
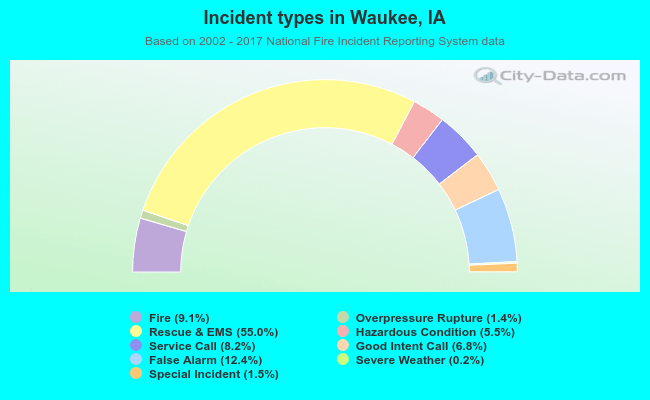 Out of all 4,814 cases reported during the years 2002 - 2017, the most belonged to the categories: Rescue & EMS (55.0%), False Alarm (12.4%), and Fire (9.1%).
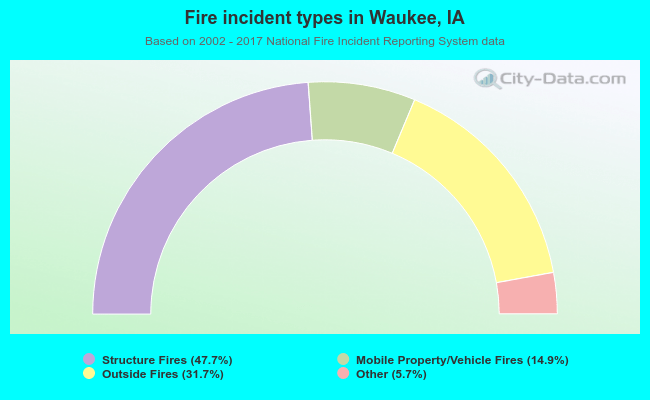 When looking into fire subcategories, the most incidents belonged to: Structure Fires (47.7%), and Outside Fires (31.7%).