Garrett: Fire Incidents, Indiana (IN)
Where are fire incidents reported in Garrett, IN
Something went wrong! Please refresh the page.
|
| |||||||||||||||||||||||||||||||||||||||||||||||||||||||||||||||||||||||||||||||||||||||||||||||||||||||||||||
2002 - 2017 National Fire Incident Reporting System (NFIRS) incidents
- Incident types reported to NFIRS in Garrett, IN
- 49537.6%Fire
- 42332.2%Rescue & EMS
- 17213.1%Hazardous Condition
- 735.6%Good Intent Call
- 564.3%Special Incident
- 524.0%Service Call
- 382.9%False Alarm
- 60.5%Overpressure Rupture
- Fire incident types reported to NFIRS in Garrett, IN
- 21743.8%Structure Fires
- 20942.2%Outside Fires
- 5110.3%Mobile Property/Vehicle Fires
- 183.6%Other
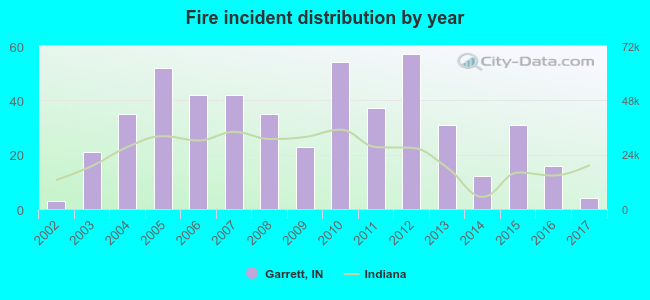 According to the data from the years 2002 - 2017 the average number of fire incidents per year is 31. The highest number of fire incidents - 57 took place in 2012, and the least - 3 in 2002. The data has an increasing trend.
The average number of yearly fire incidents per 10k residents in Garrett, IN compared to nearest cities:
(Note: Based on data for the last 3 years, including only cities with population 5,000 and above)
| Garrett: | 15.8 |
| Auburn: | 11.4 |
| Huntertown: | 16.8 |
| Kendallville: | 12.6 |
| Fort Wayne: | 23.1 |
| New Haven: | 20.8 |
| Angola: | 12.4 |
| Columbia City: | 56.6 |
| Huntington: | 30.9 |
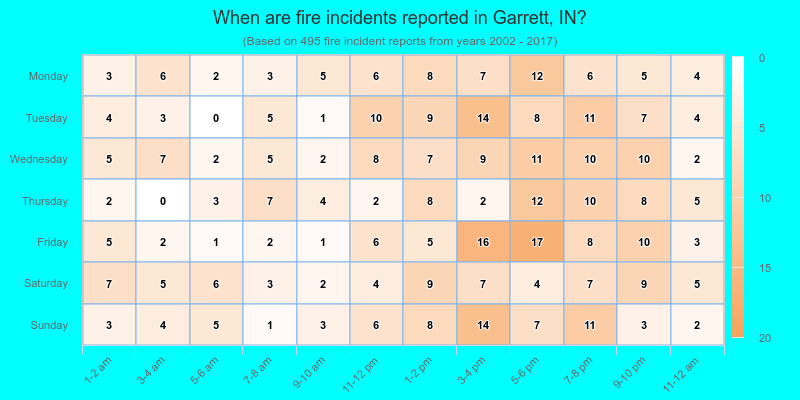
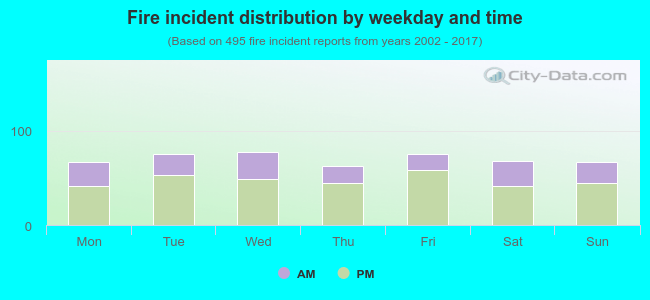 32.5% incidents where reported in the morning and 67.5% in the evening. The most fires (15.8%) took place on Wednesday, and the least (12.7%) on Thursday.
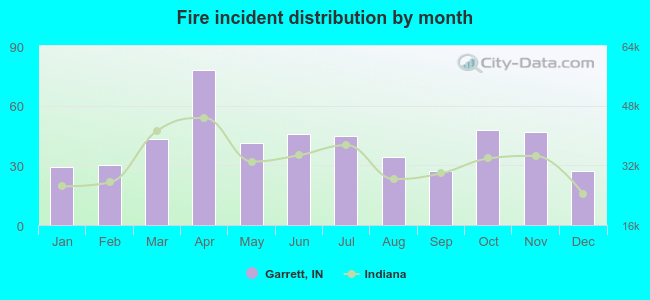 Based on the 495 fires from years 2002 - 2017 most fires (15.8%) took place during April, and the least (5.5%) in September.
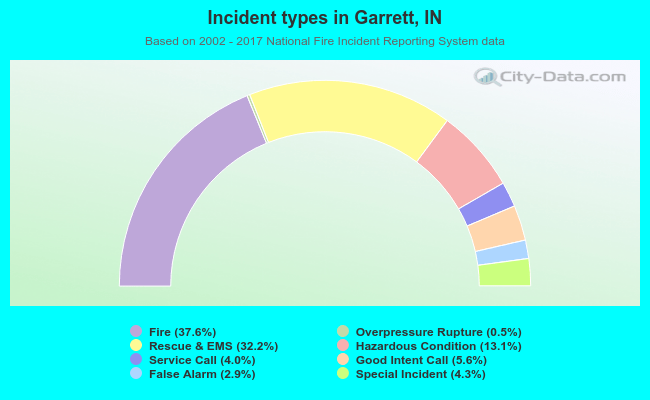 Out of all 1,315 cases reported during the years 2002 - 2017, the most belonged to the categories: Fire (37.6%), Rescue & EMS (32.2%), and Hazardous Condition (13.1%).
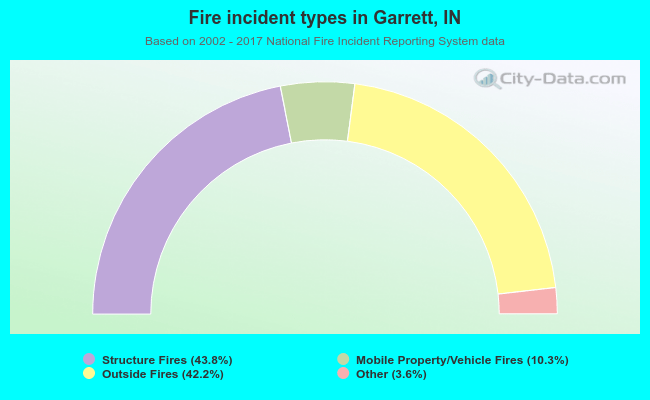 When looking into fire subcategories, the most reports belonged to: Structure Fires (43.8%), and Outside Fires (42.2%).