New Haven: Fire Incidents, Indiana (IN)
Where are fire incidents reported in New Haven, IN
Something went wrong! Please refresh the page.
| Fire incidents reported | |
|---|---|
| Sreet name | Count |
| LINCOLN HWY | 118 |
| SEILER RD | 68 |
| COURTNEY DR | 46 |
| SUMMIT ST | 46 |
| GREEN RD | 44 |
| MOELLER RD | 34 |
| DOTY RD | 30 |
| WEST ST | 30 |
| DAWKINS RD | 26 |
| BROOKDALE DR | 24 |
| HARTZELL RD | 24 |
| MELBOURNE DR | 24 |
| PARENT RD | 24 |
| ROSE AVE | 24 |
| SR 930 HWY | 24 |
| TILLMAN RD | 24 |
| MONTCLAIR DR | 22 |
| STELLHORN RD | 20 |
| CANAL ST | 18 |
| KELLER DR | 18 |
| PARK DR | 18 |
| RYAN RD | 18 |
| ADAMS CENTER RD | 16 |
| LANDIN RD | 16 |
| TYLAND BLVD | 16 |
| WOODMERE DR | 16 |
| GREEN ST | 14 |
| MAIN ST | 14 |
| MINNICH RD | 14 |
| PAULDING RD | 14 |
| Other | 121 |
2002 - 2017 National Fire Incident Reporting System (NFIRS) incidents
- Incident types reported to NFIRS in New Haven, IN
- 1,34837.7%Rescue & EMS
- 96527.0%Fire
- 75921.2%Hazardous Condition
- 2105.9%Service Call
- 1865.2%False Alarm
- 1052.9%Good Intent Call
- Fire incident types reported to NFIRS in New Haven, IN
- 71974.5%Structure Fires
- 15315.9%Outside Fires
- 727.5%Mobile Property/Vehicle Fires
- 212.2%Other
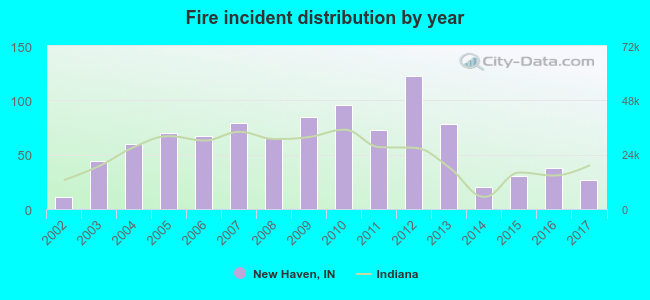 Based on the data from the years 2002 - 2017 the average number of fire incidents per year is 60. The highest number of reported fire incidents - 122 took place in 2012, and the least - 11 in 2002. The data has a growing trend.
The average number of yearly fire incidents per 10k residents in New Haven, IN compared to nearest cities:
(Note: Based on data for the last 3 years, including only cities with population 5,000 and above)
| New Haven: | 20.8 |
| Fort Wayne: | 23.1 |
| Huntertown: | 16.8 |
| Decatur: | 33.9 |
| Garrett: | 15.8 |
| Auburn: | 11.4 |
| Bluffton: | 4.3 |
| Columbia City: | 56.6 |
| Huntington: | 30.9 |
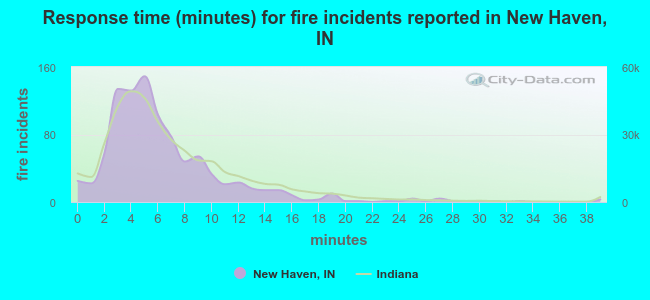 The median response time based on all reported fire incidents is 5 minutes. This is lower than the Indiana median value.
The median response time in New Haven, IN compared to nearest cities:
(Note: Based on data for all years, including only cities with at least 500 fire incidents)
| New Haven: | 5 minutes |
| Fort Wayne: | 5 minutes |
| Decatur: | 5 minutes |
| Auburn: | 4 minutes |
| Bluffton: | 6 minutes |
| Columbia City: | 7 minutes |
| Butler: | 10 minutes |
| Huntington: | 4 minutes |
| Kendallville: | 4 minutes |
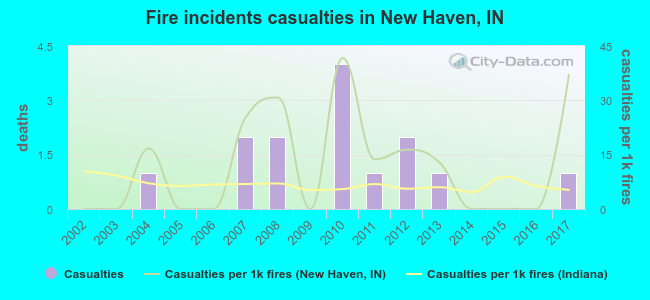 Based on the data from the years 2002 - 2017 the average number of fire-related casualties per year is 1. The highest number of reported injuries - 4 took place in 2010, and the lowest - 0 in 2002. The data has an increasing trend.
The average number of casualties per 1,000 fires is 12. This indicator was the highest - 42 in 2010, and the lowest 0 in 2002. The trend for casualties per 1,000 fires is increasing. Compared to the Indiana value the number of injuries per 1,000 fire incidents is much higher.
Based on the data from the years 2002 - 2017 the average number of fire-related casualties per year is 1. The highest number of reported injuries - 4 took place in 2010, and the lowest - 0 in 2002. The data has an increasing trend.
The average number of casualties per 1,000 fires is 12. This indicator was the highest - 42 in 2010, and the lowest 0 in 2002. The trend for casualties per 1,000 fires is increasing. Compared to the Indiana value the number of injuries per 1,000 fire incidents is much higher.Casualties per 1,000 incidents in New Haven, IN compared to nearest cities:
(Note: Based on data for all years, including only cities with at least 500 fire incidents)
| New Haven: | 14.5 |
| Fort Wayne: | 16.3 |
| Decatur: | 11.0 |
| Auburn: | 1.2 |
| Bluffton: | 7.5 |
| Columbia City: | 0.6 |
| Butler: | 0.0 |
| Huntington: | 14.6 |
| Kendallville: | 2.0 |
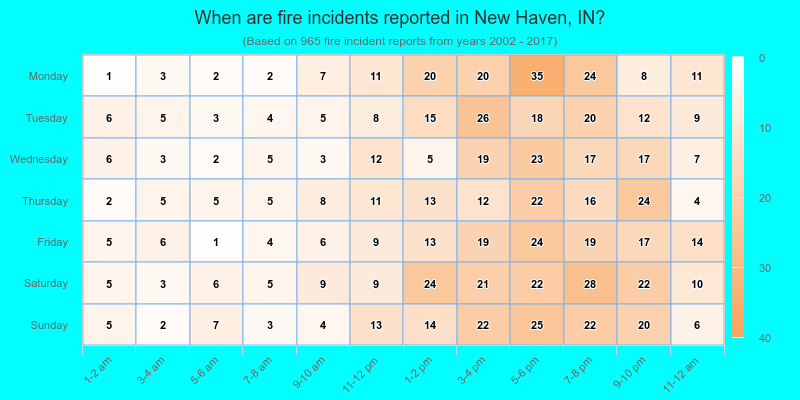
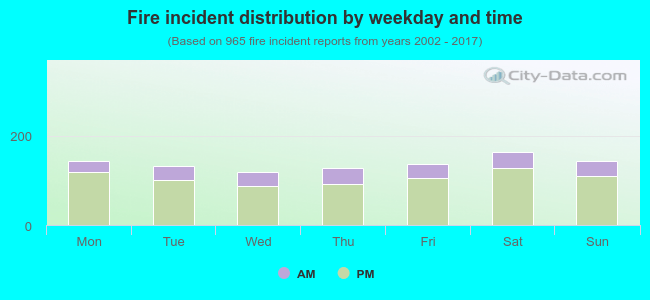 23.4% incidents where reported in the morning and 76.6% in the evening. The most fires (17.0%) took place on Saturday, and the least (12.3%) on Wednesday.
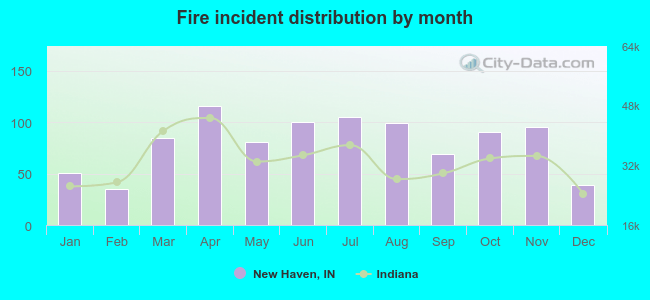 Based on the 965 fires from years 2002 - 2017 most fires (12.0%) took place during April, and the least (3.6%) in February.
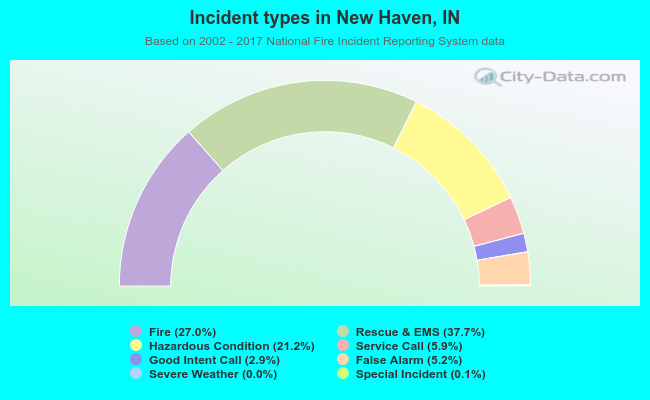 Out of all 3,577 cases reported during the years 2002 - 2017, the most belonged to the categories: Overpressure Rupture (37.7%), Fire (27.0%), and Rescue & EMS (21.2%).
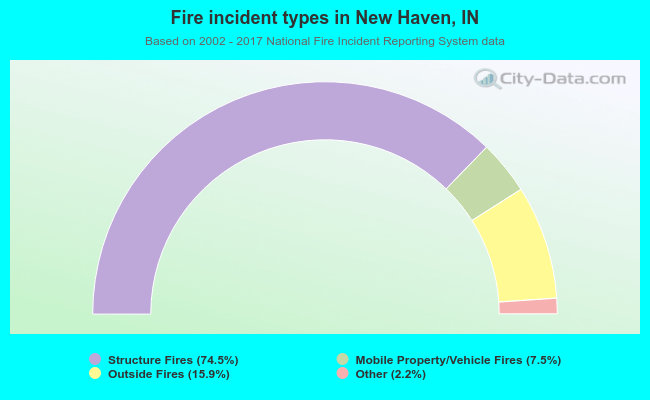 When looking into fire subcategories, the most incidents belonged to: Structure Fires (74.5%), and Outside Fires (15.9%).