Fort Wayne: Fire Incidents, Indiana (IN)
Where are fire incidents reported in Fort Wayne, IN
Something went wrong! Please refresh the page.
| Fire incidents reported | |
|---|---|
| Sreet name | Count |
| JEFFERSON BLVD | 324 |
| COLISEUM BLVD | 300 |
| STATE BLVD | 276 |
| CLINTON ST | 244 |
| ANTHONY BLVD | 228 |
| COLDWATER RD | 228 |
| DECATUR RD | 220 |
| WASHINGTON BLVD | 214 |
| LIMA RD | 208 |
| WASHINGTON CENTER RD | 196 |
| DUPONT RD | 192 |
| CALHOUN ST | 170 |
| FAIRFIELD AVE | 170 |
| ST JOE CENTER RD | 166 |
| ILLINOIS RD | 152 |
| ST JOE RD | 146 |
| HARRISON ST | 140 |
| GOSHEN RD | 138 |
| HANNA ST | 130 |
| PAULDING RD | 130 |
| WINTER ST | 130 |
| RUDISILL BLVD | 126 |
| BLUFFTON RD | 124 |
| COVINGTON RD | 124 |
| ST MARYS AVE | 120 |
| MAIN ST | 118 |
| MAYSVILLE RD | 114 |
| BOWSER AVE | 108 |
| STELLHORN RD | 108 |
| WELLS ST | 108 |
| Other | 8,440 |
2002 - 2018 National Fire Incident Reporting System (NFIRS) incidents
- Incident types reported to NFIRS in Fort Wayne, IN
- 21,49626.8%Rescue & EMS
- 18,25122.7%Hazardous Condition
- 15,21718.9%Good Intent Call
- 13,59216.9%Fire
- 7,3649.2%Service Call
- 4,1635.2%False Alarm
- 1140.1%Severe Weather
- Fire incident types reported to NFIRS in Fort Wayne, IN
- 5,76042.4%Structure Fires
- 4,73634.8%Outside Fires
- 2,25516.6%Mobile Property/Vehicle Fires
- 8416.2%Other
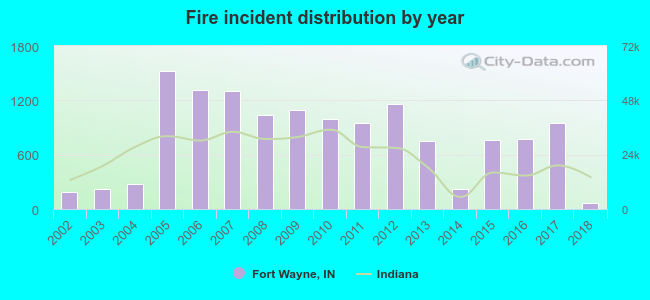 Based on the data from the years 2002 - 2018 the average number of fire incidents per year is 800. The highest number of fires - 1,521 took place in 2005, and the least - 71 in 2018. The data has a declining trend.
The average number of yearly fire incidents per 10k residents in Fort Wayne, IN compared to nearest cities:
(Note: Based on data for the last 3 years, including only cities with population 5,000 and above)
| Fort Wayne: | 23.1 |
| New Haven: | 20.8 |
| Huntertown: | 16.8 |
| Garrett: | 15.8 |
| Columbia City: | 56.6 |
| Decatur: | 33.9 |
| Auburn: | 11.4 |
| Huntington: | 30.9 |
| Bluffton: | 4.3 |
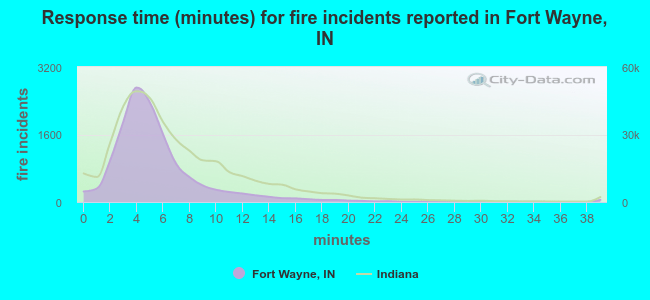 The median response time based on all reported fire incidents is 5 minutes. This is lower than the state median value.
The median response time in Fort Wayne, IN compared to nearest cities:
(Note: Based on data for all years, including only cities with at least 500 fire incidents)
| Fort Wayne: | 5 minutes |
| New Haven: | 5 minutes |
| Columbia City: | 7 minutes |
| Decatur: | 5 minutes |
| Auburn: | 4 minutes |
| Huntington: | 4 minutes |
| Bluffton: | 6 minutes |
| Kendallville: | 4 minutes |
| Albion: | 10 minutes |
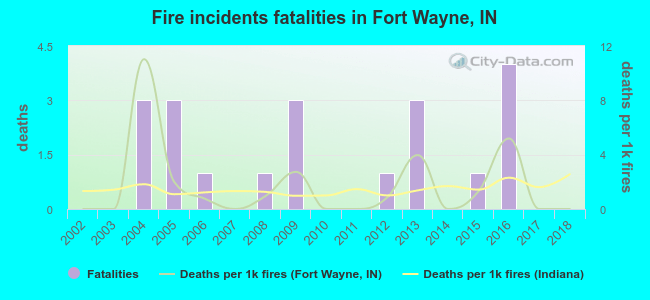 Based on the data from the years 2002 - 2018 the average number of fire-related yearly deaths is 1. The highest number of deaths - 4 took place in 2016, and the lowest - 0 in 2002. The data has a constant trend.
The average number of deaths per 1,000 fire incidents is 2. This indicator was the highest - 11 in 2004, and the lowest 0 in 2002. The trend for deaths per 1,000 incidents is dropping. Compared to the state value the number of deaths per 1,000 incidents is about the same.
Based on the data from the years 2002 - 2018 the average number of fire-related yearly deaths is 1. The highest number of deaths - 4 took place in 2016, and the lowest - 0 in 2002. The data has a constant trend.
The average number of deaths per 1,000 fire incidents is 2. This indicator was the highest - 11 in 2004, and the lowest 0 in 2002. The trend for deaths per 1,000 incidents is dropping. Compared to the state value the number of deaths per 1,000 incidents is about the same.Deaths per 1,000 incidents in Fort Wayne, IN compared to nearest cities:
(Note: Based on data for all years, including only cities with at least 2,500 fire incidents)
| Fort Wayne: | 1.5 |
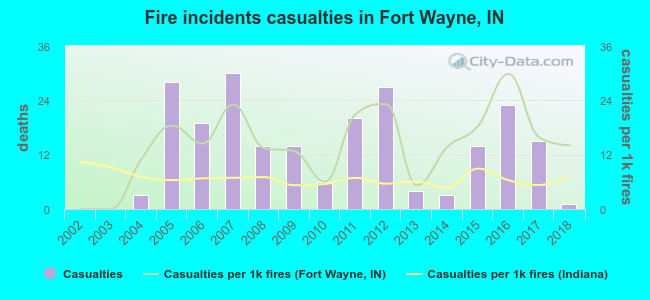 Based on the data from the years 2002 - 2018 the average number of fire-related yearly casualties is 13. The highest number of casualties - 30 took place in 2007, and the lowest - 0 in 2002. The data has a growing trend.
The average number of injuries per 1,000 fires is 14. This indicator was the highest - 30 in 2016, and the lowest 0 in 2002. The trend for injuries per 1,000 fire incidents is growing. Compared to the Indiana value the number of casualties per 1,000 fire incidents is much higher.
Based on the data from the years 2002 - 2018 the average number of fire-related yearly casualties is 13. The highest number of casualties - 30 took place in 2007, and the lowest - 0 in 2002. The data has a growing trend.
The average number of injuries per 1,000 fires is 14. This indicator was the highest - 30 in 2016, and the lowest 0 in 2002. The trend for injuries per 1,000 fire incidents is growing. Compared to the Indiana value the number of casualties per 1,000 fire incidents is much higher.Casualties per 1,000 incidents in Fort Wayne, IN compared to nearest cities:
(Note: Based on data for all years, including only cities with at least 500 fire incidents)
| Fort Wayne: | 16.3 |
| New Haven: | 14.5 |
| Columbia City: | 0.6 |
| Decatur: | 11.0 |
| Auburn: | 1.2 |
| Huntington: | 14.6 |
| Bluffton: | 7.5 |
| Kendallville: | 2.0 |
| Albion: | 1.5 |
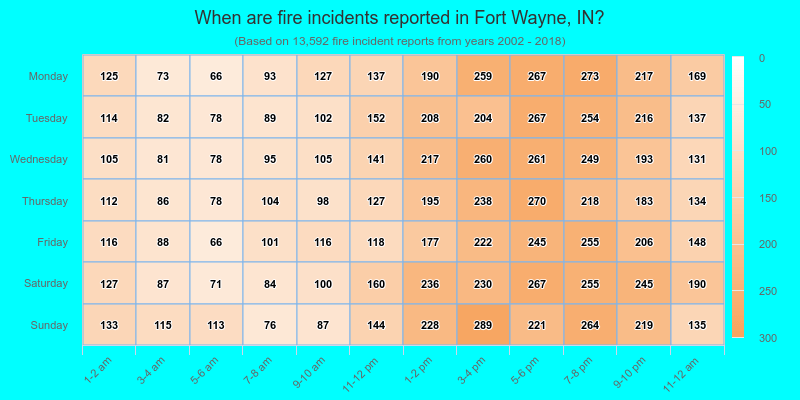
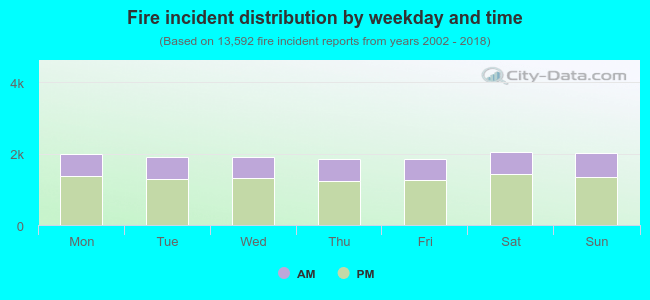 32.0% incidents where reported in the morning and 68.0% in the evening. The most fires (15.1%) took place on Saturday, and the least (13.6%) on Thursday.
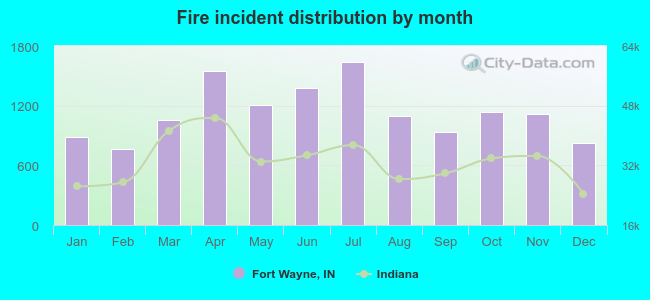 Based on the 13,592 fire incident reports from years 2002 - 2018 most fires (12.1%) took place during July, and the least (5.6%) in February.
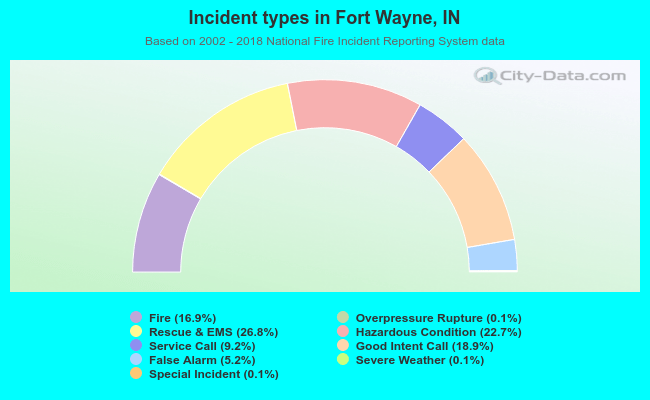 Out of all 80,341 cases reported during the years 2002 - 2018, the most belonged to the categories: Rescue & EMS (26.8%), Hazardous Condition (22.7%), and Good Intent Call (18.9%).
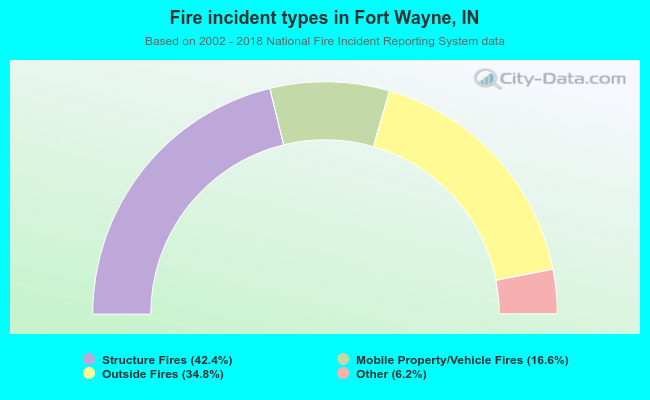 When looking into fire subcategories, the most incidents belonged to: Structure Fires (42.4%), and Outside Fires (34.8%).