Whitestown: Fire Incidents, Indiana (IN)
Where are fire incidents reported in Whitestown, IN
Something went wrong! Please refresh the page.
|
| |||||||||||||||||||||||||||||||||||||||||||||||||||||||||||||||||||||||||||||||||||||||||||||||||||||||||||||
2002 - 2018 National Fire Incident Reporting System (NFIRS) incidents
- Incident types reported to NFIRS in Whitestown, IN
- 60645.1%Rescue & EMS
- 30322.5%Fire
- 1188.8%Hazardous Condition
- 1057.8%Service Call
- 1047.7%False Alarm
- 997.4%Good Intent Call
- 50.4%Special Incident
- 40.3%Overpressure Rupture
- Fire incident types reported to NFIRS in Whitestown, IN
- 12942.6%Outside Fires
- 9130.0%Structure Fires
- 5718.8%Mobile Property/Vehicle Fires
- 268.6%Other
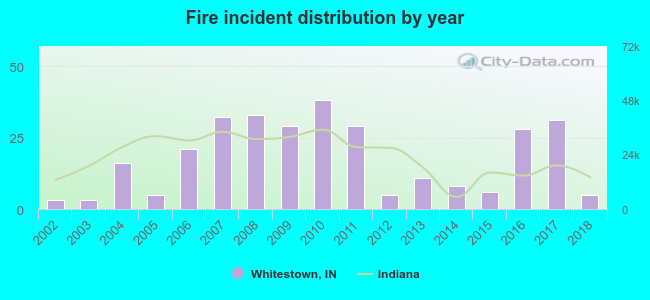 According to the data from the years 2002 - 2018 the average number of fires per year is 18. The highest number of reported fire incidents - 38 took place in 2010, and the least - 3 in 2002. The data has a growing trend.
The average number of yearly fire incidents per 10k residents in Whitestown, IN compared to nearest cities:
(Note: Based on data for the last 3 years, including only cities with population 5,000 and above)
| Whitestown: | 40.6 |
| Zionsville: | 16.1 |
| Lebanon: | 10.9 |
| Brownsburg: | 19.2 |
| Westfield: | 17.8 |
| Carmel: | 2.9 |
| Speedway: | 40.2 |
| Avon: | 44.2 |
| Noblesville: | 17.4 |

 28.7% incidents where reported in the morning and 71.3% in the evening. The most fires (16.8%) took place on Sunday, and the least (10.6%) on Thursday.
 Based on the 303 incident reports from years 2002 - 2018 most fires (13.5%) took place during November, and the least (5.6%) in March.
 Out of all 1,344 cases reported during the years 2002 - 2018, the most belonged to the categories: Rescue & EMS (45.1%), Fire (22.5%), and Hazardous Condition (8.8%).
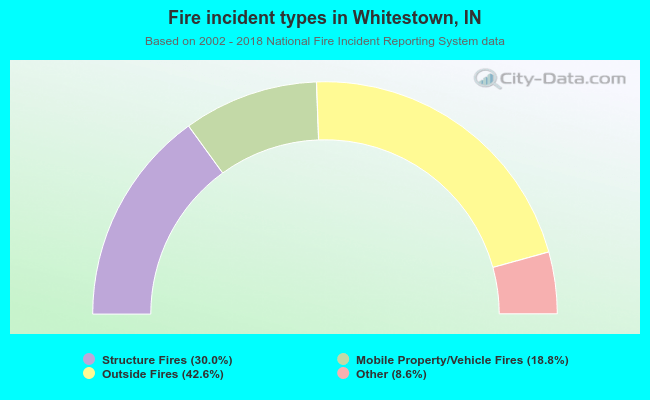 When looking into fire subcategories, the most reports belonged to: Outside Fires (42.6%), and Structure Fires (30.0%).