Warrenville: Fire Incidents, Illinois (IL)
Where are fire incidents reported in Warrenville, IL
Something went wrong! Please refresh the page.
| Fire incidents reported | |
|---|---|
| Sreet name | Count |
| ROUTE 59 | 112 |
| DIEHL RD | 108 |
| COUNTRY RIDGE DR | 84 |
| BUTTERFIELD RD | 70 |
| WINFIELD RD | 52 |
| WINCHESTER CIR | 46 |
| GALUSHA AVE | 40 |
| WARRENVILLE RD | 36 |
| FERRY RD | 28 |
| BATAVIA RD | 26 |
| WILLIAMS RD | 26 |
| CONTINENTAL DR | 24 |
| CURTIS AVE | 24 |
| VILLAGE GREEN BLVD | 24 |
| WARREN AVE | 24 |
| TOWNLINE RD | 20 |
| MAECLIFF DR | 18 |
| TIMBER DR | 18 |
| CALUMET AVE | 16 |
| EMERALD GREEN DR | 16 |
| ROGERS AVE | 16 |
| WILBUR AVE | 16 |
| BELLA VISTA PKY | 14 |
| FORESTVIEW DR | 14 |
| BIRCHWOOD DR | 12 |
| GREENVIEW AVE | 12 |
| MELCHER AVE | 12 |
| RIVER OAKS DR | 12 |
| VIRGINIA AVE | 12 |
| WEAVER PKY | 12 |
2002 - 2018 National Fire Incident Reporting System (NFIRS) incidents
- Incident types reported to NFIRS in Warrenville, IL
- 4,12242.3%Rescue & EMS
- 1,74617.9%False Alarm
- 1,22712.6%Hazardous Condition
- 1,03110.6%Service Call
- 8749.0%Good Intent Call
- 7187.4%Fire
- 120.1%Severe Weather
- Fire incident types reported to NFIRS in Warrenville, IL
- 29240.7%Structure Fires
- 29140.5%Outside Fires
- 9112.7%Mobile Property/Vehicle Fires
- 446.1%Other
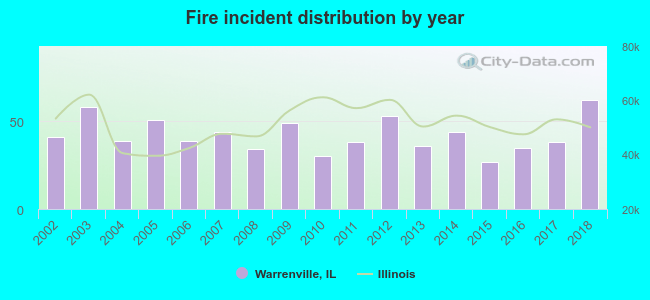 According to the data from the years 2002 - 2018 the average number of fires per year is 42. The highest number of reported fires - 62 took place in 2018, and the least - 27 in 2015. The data has a growing trend.
The average number of yearly fire incidents per 10k residents in Warrenville, IL compared to nearest cities:
(Note: Based on data for the last 3 years, including only cities with population 5,000 and above)
| Warrenville: | 33.7 |
| Winfield: | 33.8 |
| West Chicago: | 40.1 |
| Wheaton: | 18.3 |
| Naperville: | 16.1 |
| Lisle: | 29.1 |
| Batavia: | 30.0 |
| Carol Stream: | 21.1 |
| Glen Ellyn: | 26.9 |
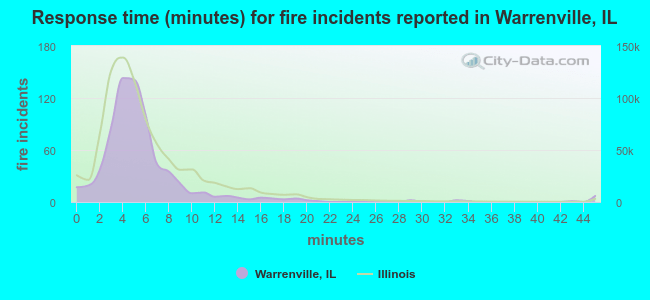 The median response time based on all reported fire incidents is 5 minutes. This is close to the Illinois median value.
The median response time in Warrenville, IL compared to nearest cities:
(Note: Based on data for all years, including only cities with at least 500 fire incidents)
| Warrenville: | 5 minutes |
| Winfield: | 5 minutes |
| West Chicago: | 6 minutes |
| Wheaton: | 5 minutes |
| Naperville: | 5 minutes |
| Lisle: | 5 minutes |
| Batavia: | 5 minutes |
| Carol Stream: | 5 minutes |
| Glen Ellyn: | 6 minutes |
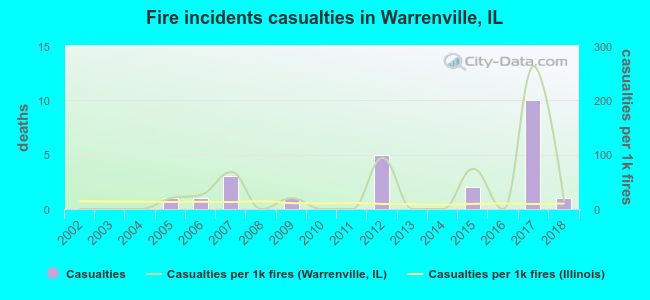 According to the data from the years 2002 - 2018 the average number of fire-related yearly casualties is 1. The highest number of injuries - 10 took place in 2017, and the lowest - 0 in 2002. The data has an increasing trend.
The average number of casualties per 1,000 fire incidents is 34. This indicator was the highest - 263 in 2017, and the lowest 0 in 2002. The trend for injuries per 1,000 incidents is increasing. Compared to the Illinois value the number of casualties per 1,000 incidents is much higher.
According to the data from the years 2002 - 2018 the average number of fire-related yearly casualties is 1. The highest number of injuries - 10 took place in 2017, and the lowest - 0 in 2002. The data has an increasing trend.
The average number of casualties per 1,000 fire incidents is 34. This indicator was the highest - 263 in 2017, and the lowest 0 in 2002. The trend for injuries per 1,000 incidents is increasing. Compared to the Illinois value the number of casualties per 1,000 incidents is much higher.Casualties per 1,000 incidents in Warrenville, IL compared to nearest cities:
(Note: Based on data for all years, including only cities with at least 500 fire incidents)
| Warrenville: | 33.4 |
| Winfield: | 3.4 |
| West Chicago: | 20.6 |
| Wheaton: | 12.6 |
| Naperville: | 23.5 |
| Lisle: | 26.1 |
| Batavia: | 10.8 |
| Carol Stream: | 7.4 |
| Glen Ellyn: | 12.2 |
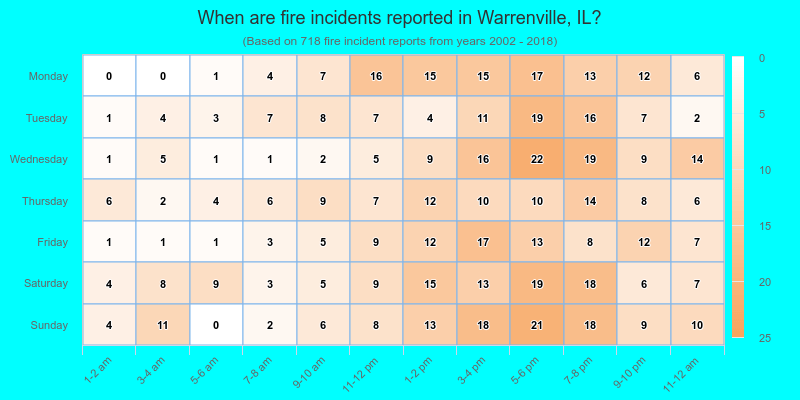
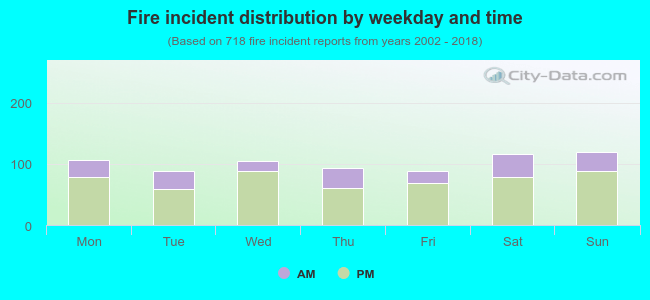 27.3% incidents where reported in the morning and 72.7% in the evening. The most fires (16.7%) took place on Sunday, and the least (12.4%) on Tuesday.
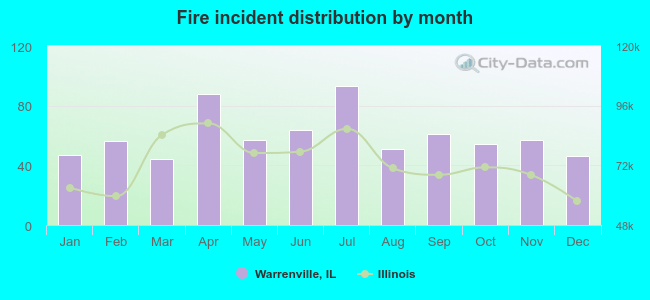 Based on the 718 incident reports from years 2002 - 2018 most fires (13.0%) took place during July, and the least (6.1%) in March.
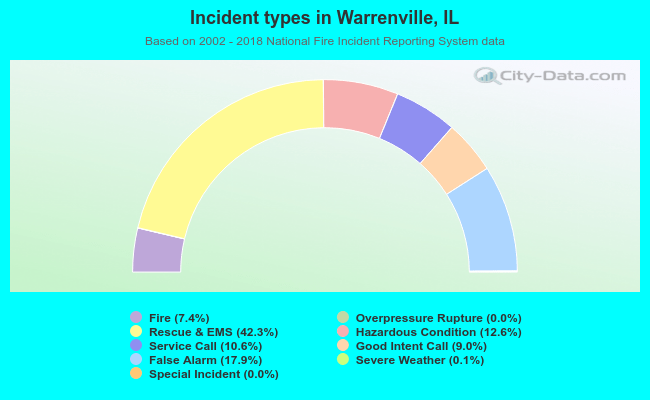 Out of all 9,737 cases reported during the years 2002 - 2018, the most belonged to the categories: Rescue & EMS (42.3%), False Alarm (17.9%), and Hazardous Condition (12.6%).
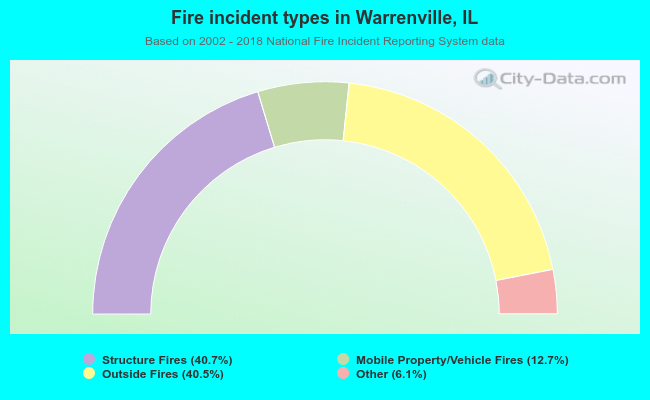 When looking into fire subcategories, the most incidents belonged to: Structure Fires (40.7%), and Outside Fires (40.5%).