Malta: Fire Incidents, New York (NY)
Where are fire incidents reported in Malta, NY
Something went wrong! Please refresh the page.
|
| |||||||||||||||||||||||||||||||||||||||||||||||||||||||||||||||||||||||||||||||||||||||||||||||||||||||||||||
2002 - 2018 National Fire Incident Reporting System (NFIRS) incidents
- Incident types reported to NFIRS in Malta, NY
- 82528.6%False Alarm
- 44515.4%Hazardous Condition
- 44015.3%Rescue & EMS
- 40814.1%Service Call
- 38613.4%Good Intent Call
- 35812.4%Fire
- 160.6%Severe Weather
- 50.2%Overpressure Rupture
- Fire incident types reported to NFIRS in Malta, NY
- 13537.7%Structure Fires
- 13537.7%Outside Fires
- 7621.2%Mobile Property/Vehicle Fires
- 123.4%Other
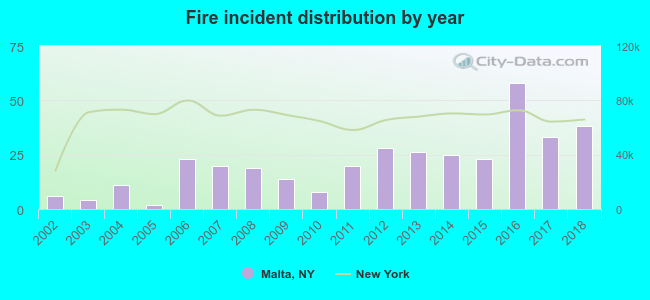 Based on the data from the years 2002 - 2018 the average number of fire incidents per year is 21. The highest number of fire incidents - 58 took place in 2016, and the least - 2 in 2005. The data has an increasing trend.
The average number of yearly fire incidents per 10k residents in Malta, NY compared to nearest cities:
(Note: Based on data for the last 3 years, including only cities with population 5,000 and above)
| Malta: | 29.1 |
| Ballston Spa: | 17.9 |
| Clifton Park: | 34.1 |
| Mechanicville: | 55.4 |
| Saratoga Springs: | 38.1 |
| Halfmoon: | 15.6 |
| East Glenville: | 1.5 |
| Glenville: | 67.6 |
| Greenfield: | 14.8 |
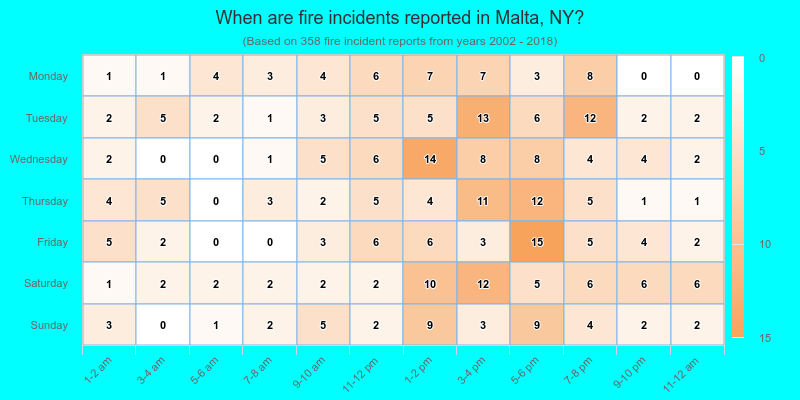
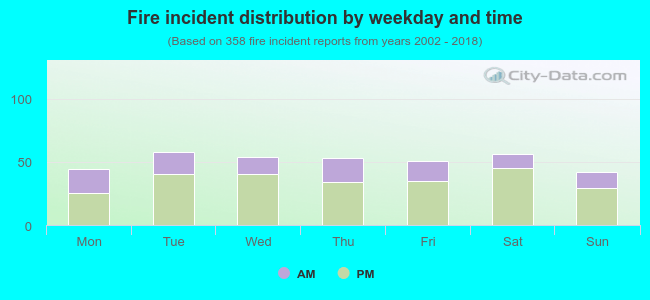 30.7% incidents where reported in the morning and 69.3% in the evening. The most fires (16.2%) took place on Tuesday, and the least (11.7%) on Sunday.
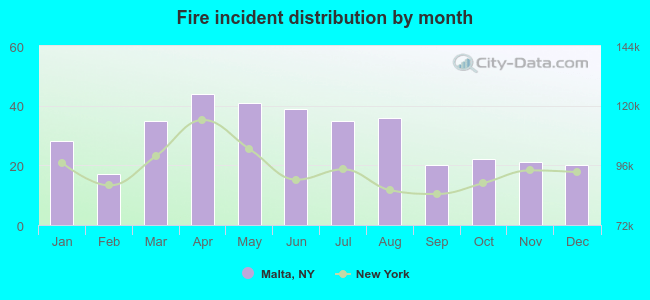 According to the 358 fire incidents from years 2002 - 2018 most fires (12.3%) took place during April, and the least (4.7%) in February.
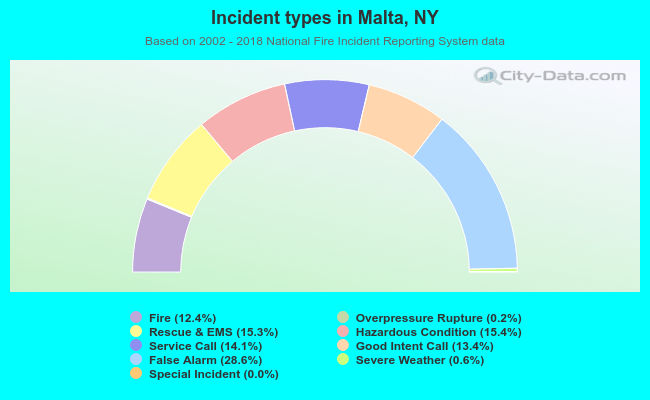 Out of all 2,884 cases reported during the years 2002 - 2018, the most belonged to the categories: False Alarm (28.6%), Hazardous Condition (15.4%), and Rescue & EMS (15.3%).
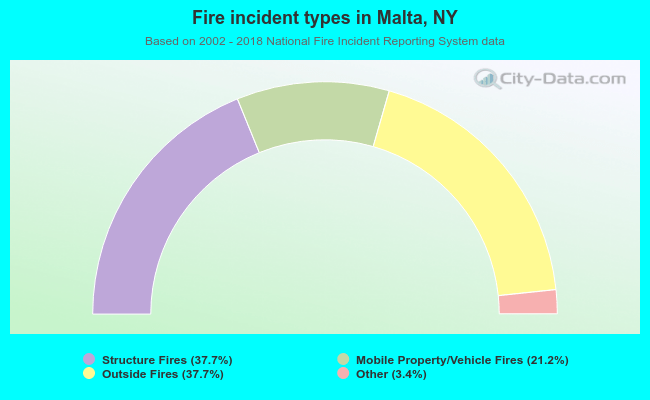 When looking into fire subcategories, the most reports belonged to: Structure Fires (37.7%), and Outside Fires (37.7%).