Greenfield: Fire Incidents, New York (NY)
Where are fire incidents reported in Greenfield, NY
Something went wrong! Please refresh the page.
|
| |||||||||||||||||||||||||||||||||||||||||||||||||||||||||||||||||||||||||||||||||||||||||||||||||||||||||||||
2003 - 2017 National Fire Incident Reporting System (NFIRS) incidents
- Incident types reported to NFIRS in Greenfield, NY
- 39837.9%Rescue & EMS
- 29628.2%Fire
- 19318.4%Hazardous Condition
- 666.3%False Alarm
- 555.2%Good Intent Call
- 393.7%Service Call
- 20.2%Severe Weather
- Fire incident types reported to NFIRS in Greenfield, NY
- 12943.6%Other
- 9933.4%Structure Fires
- 4715.9%Outside Fires
- 217.1%Mobile Property/Vehicle Fires
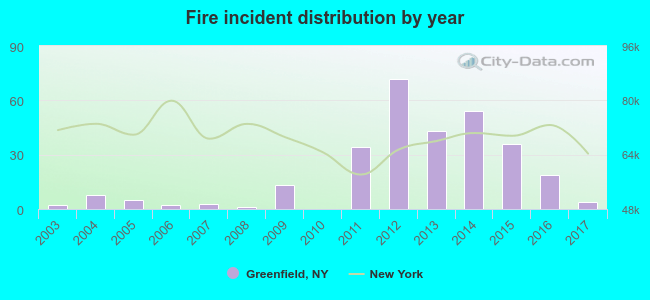 Based on the data from the years 2003 - 2017 the average number of fires per year is 20. The highest number of reported fires - 72 took place in 2012, and the least - 0 in 2010. The data has an increasing trend.
The average number of yearly fire incidents per 10k residents in Greenfield, NY compared to nearest cities:
(Note: Based on data for the last 3 years, including only cities with population 5,000 and above)
| Greenfield: | 14.8 |
| Saratoga Springs: | 38.1 |
| Wilton: | 11.3 |
| Ballston Spa: | 17.9 |
| Malta: | 29.1 |
| Northumberland: | 2.0 |
| Moreau: | 11.1 |
| Glens Falls: | 37.4 |
| East Glenville: | 1.5 |
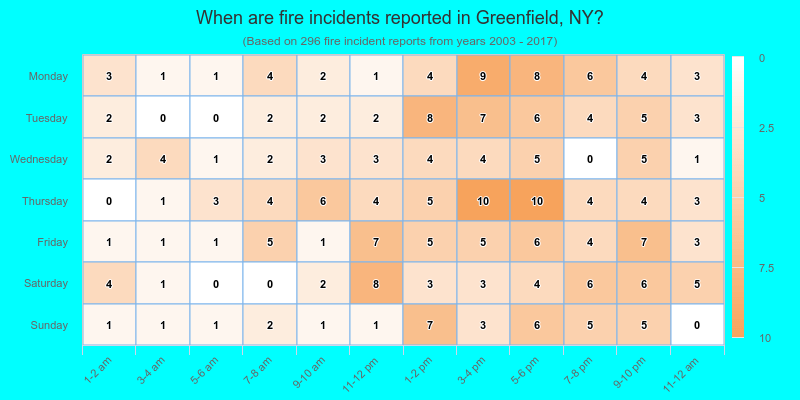
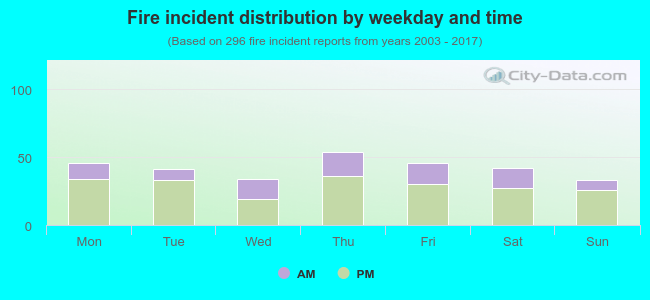 30.7% incidents where reported in the morning and 69.3% in the evening. The most fires (18.2%) took place on Thursday, and the least (11.1%) on Sunday.
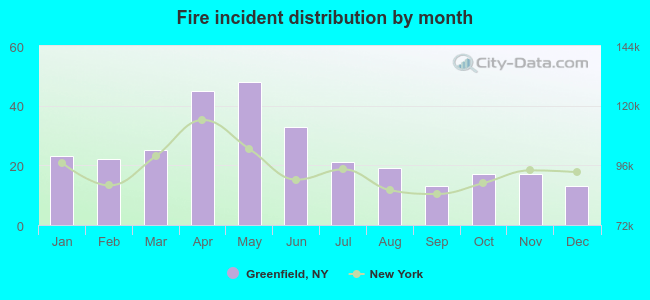 Based on the 296 fire incidents from years 2003 - 2017 most fires (16.2%) took place during May, and the least (4.4%) in September.
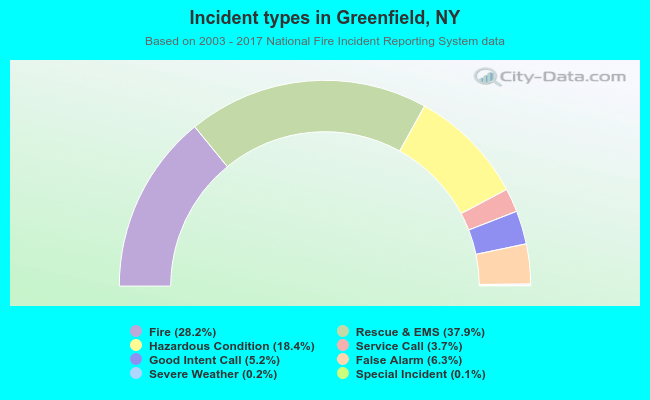 Out of all 1,050 cases reported during the years 2003 - 2017, the most belonged to the categories: Overpressure Rupture (37.9%), Fire (28.2%), and Rescue & EMS (18.4%).
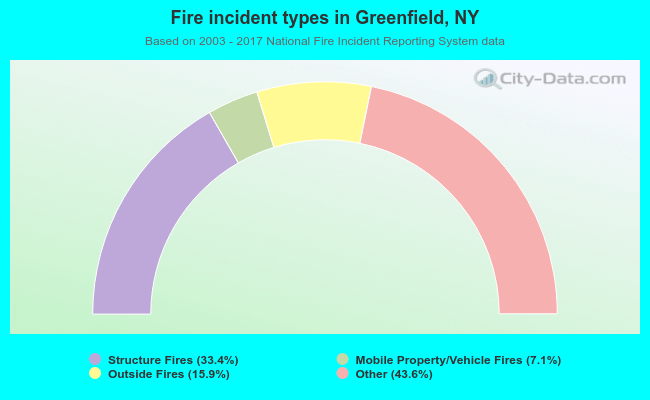 When looking into fire subcategories, the most incidents belonged to: Other (43.6%), and Structure Fires (33.4%).