Ballston Spa: Fire Incidents, New York (NY)
Where are fire incidents reported in Ballston Spa, NY
Something went wrong! Please refresh the page.
|
| |||||||||||||||||||||||||||||||||||||||||||||||||||||||||||||||||||||||||||||||||||||||||||||||||||||||||||||
2002 - 2018 National Fire Incident Reporting System (NFIRS) incidents
- Incident types reported to NFIRS in Ballston Spa, NY
- 66932.0%Hazardous Condition
- 47522.7%Rescue & EMS
- 33716.1%False Alarm
- 25212.1%Service Call
- 20810.0%Good Intent Call
- 1286.1%Fire
- 120.6%Severe Weather
- 80.4%Overpressure Rupture
- Fire incident types reported to NFIRS in Ballston Spa, NY
- 7558.6%Structure Fires
- 2519.5%Outside Fires
- 1511.7%Other
- 1310.2%Mobile Property/Vehicle Fires
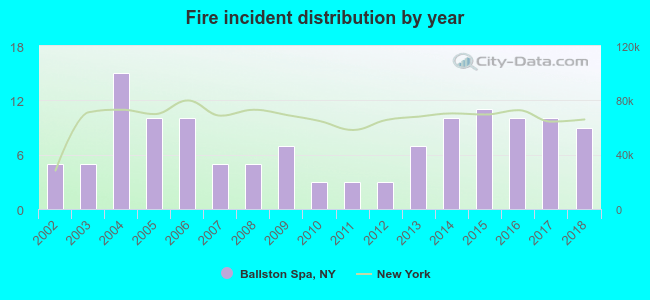 Based on the data from the years 2002 - 2018 the average number of fires per year is 8. The highest number of reported fires - 15 took place in 2004, and the least - 3 in 2010. The data has a rising trend.
The average number of yearly fire incidents per 10k residents in Ballston Spa, NY compared to nearest cities:
(Note: Based on data for the last 3 years, including only cities with population 5,000 and above)
| Ballston Spa: | 17.9 |
| Malta: | 29.1 |
| Saratoga Springs: | 38.1 |
| Greenfield: | 14.8 |
| Clifton Park: | 34.1 |
| East Glenville: | 1.5 |
| Mechanicville: | 55.4 |
| Wilton: | 11.3 |
| Glenville: | 67.6 |

 35.2% incidents where reported in the morning and 64.8% in the evening. The most fires (21.9%) took place on Sunday, and the least (9.4%) on Wednesday.
 Based on the 128 reports from years 2002 - 2018 most fires (17.2%) took place during January, and the least (2.3%) in June.
 Out of all 2,089 cases reported during the years 2002 - 2018, the most belonged to the categories: Hazardous Condition (32.0%), Rescue & EMS (22.7%), and False Alarm (16.1%).
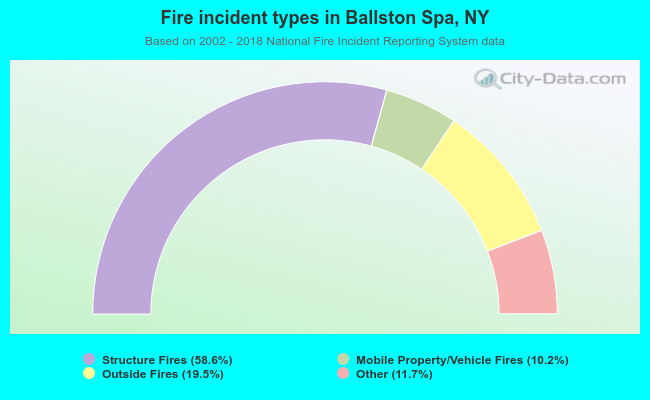 When looking into fire subcategories, the most incidents belonged to: Structure Fires (58.6%), and Outside Fires (19.5%).