Saratoga Springs: Fire Incidents, New York (NY)
Where are fire incidents reported in Saratoga Springs, NY
Something went wrong! Please refresh the page.
| Fire incidents reported | |
|---|---|
| Sreet name | Count |
| BROADWAY | 286 |
| LAWRENCE ST | 124 |
| BALLSTON AVE | 120 |
| ROUTE 50 | 92 |
| UNION AVE | 88 |
| CHURCH ST | 70 |
| LAKE AVE | 58 |
| NELSON AVE | 54 |
| EXCELSIOR AVE | 50 |
| WEST AVE | 48 |
| WASHINGTON ST | 44 |
| CIRCULAR ST | 36 |
| CONGRESS ST | 36 |
| I87 | 34 |
| CAROLINE ST | 32 |
| MAPLE AVE | 32 |
| KIRBY RD | 30 |
| LOUDEN RD | 30 |
| GRAND AVE | 26 |
| RUGGLES RD | 26 |
| WEIBEL AVE | 26 |
| DIVISION ST | 24 |
| DUPLAINVILLE RD | 24 |
| EAST AVE | 22 |
| FEDERAL ST | 22 |
| GEYSER RD | 22 |
| JEFFERSON TER | 22 |
| OLD GICK RD | 20 |
| TROTTINGHAM RD | 20 |
| VANDERBILT TER | 20 |
| Other | 312 |
2002 - 2018 National Fire Incident Reporting System (NFIRS) incidents
- Incident types reported to NFIRS in Saratoga Springs, NY
- 19,30463.0%Rescue & EMS
- 3,36311.0%False Alarm
- 2,7429.0%Hazardous Condition
- 2,3367.6%Good Intent Call
- 1,8506.0%Fire
- 9383.1%Service Call
- 430.1%Overpressure Rupture
- 320.1%Special Incident
- Fire incident types reported to NFIRS in Saratoga Springs, NY
- 97752.8%Structure Fires
- 35018.9%Outside Fires
- 31016.8%Mobile Property/Vehicle Fires
- 21311.5%Other
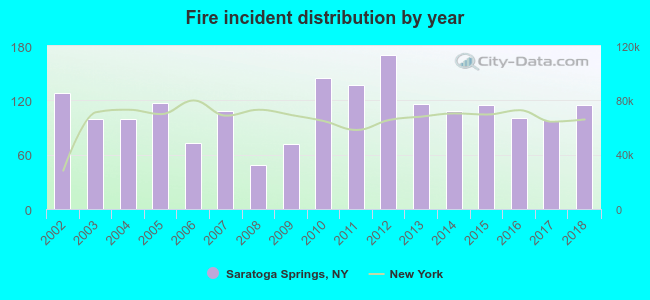 Based on the data from the years 2002 - 2018 the average number of fires per year is 109. The highest number of fire incidents - 170 took place in 2012, and the least - 49 in 2008. The data has a declining trend.
The average number of yearly fire incidents per 10k residents in Saratoga Springs, NY compared to nearest cities:
(Note: Based on data for the last 3 years, including only cities with population 5,000 and above)
| Saratoga Springs: | 38.1 |
| Wilton: | 11.3 |
| Greenfield: | 14.8 |
| Ballston Spa: | 17.9 |
| Malta: | 29.1 |
| Northumberland: | 2.0 |
| Mechanicville: | 55.4 |
| Clifton Park: | 34.1 |
| Moreau: | 11.1 |
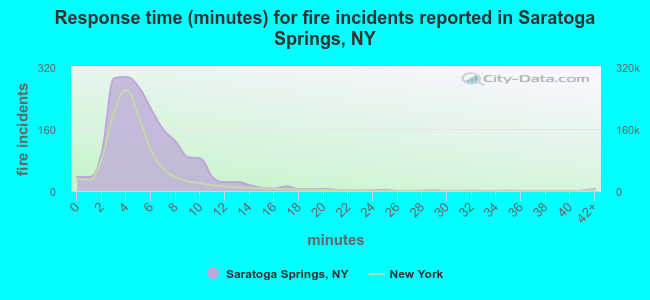 The median response time based on all reported fire incidents is 5 minutes. This is higher compared to the New York median value.
The median response time in Saratoga Springs, NY compared to nearest cities:
(Note: Based on data for all years, including only cities with at least 500 fire incidents)
| Saratoga Springs: | 5 minutes |
| Mechanicville: | 5 minutes |
| Clifton Park: | 6 minutes |
| Halfmoon: | 6 minutes |
| Glenville: | 4 minutes |
| Glens Falls: | 3 minutes |
| Hudson Falls: | 7 minutes |
| Queensbury: | 5 minutes |
| Niskayuna: | 4 minutes |
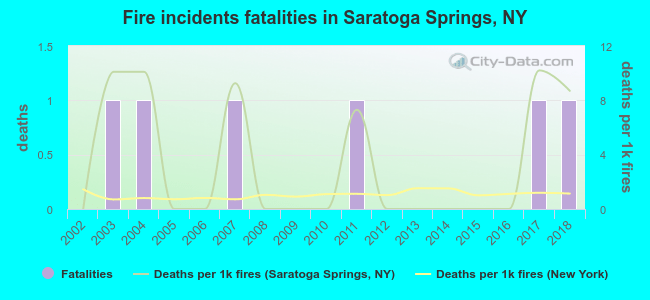 Based on the data from the years 2002 - 2018 the average number of fire-related fatalities per year is 0. The highest number of reported deaths - 1 took place in 2003, and the lowest - 0 in 2002. The data has an increasing trend.
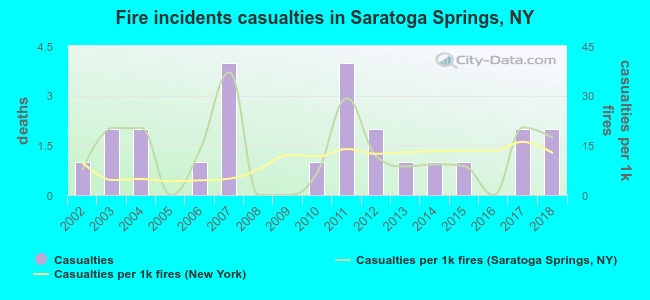 Based on the data from the years 2002 - 2018 the average number of fire-related yearly casualties is 1. The highest number of casualties - 4 took place in 2007, and the lowest - 0 in 2005. The data has an increasing trend.
The average number of injuries per 1,000 fires is 12. This indicator was the highest - 37 in 2007, and the lowest 0 in 2005. The trend for casualties per 1,000 fire incidents is growing. Compared to the state value the number of injuries per 1,000 fire incidents is higher.
Based on the data from the years 2002 - 2018 the average number of fire-related yearly casualties is 1. The highest number of casualties - 4 took place in 2007, and the lowest - 0 in 2005. The data has an increasing trend.
The average number of injuries per 1,000 fires is 12. This indicator was the highest - 37 in 2007, and the lowest 0 in 2005. The trend for casualties per 1,000 fire incidents is growing. Compared to the state value the number of injuries per 1,000 fire incidents is higher.Casualties per 1,000 incidents in Saratoga Springs, NY compared to nearest cities:
(Note: Based on data for all years, including only cities with at least 500 fire incidents)
| Saratoga Springs: | 13.0 |
| Mechanicville: | 9.4 |
| Clifton Park: | 6.7 |
| Halfmoon: | 6.8 |
| Glenville: | 2.2 |
| Glens Falls: | 42.5 |
| Hudson Falls: | 6.7 |
| Queensbury: | 4.1 |
| Niskayuna: | 13.8 |
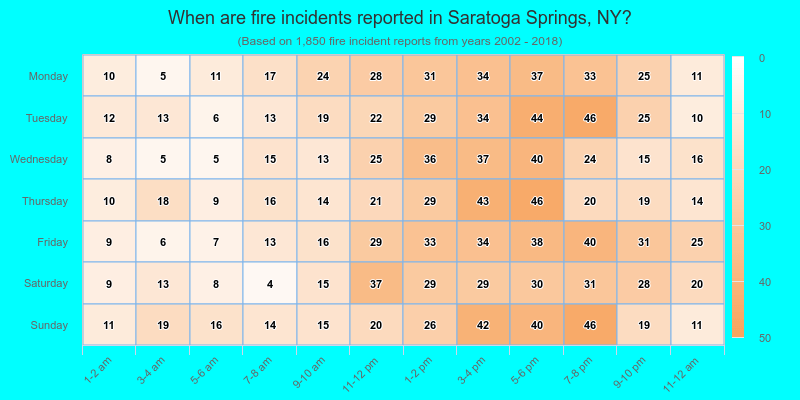
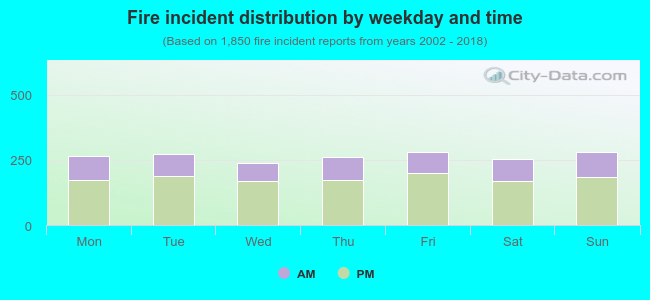 32.4% incidents where reported in the morning and 67.6% in the evening. The most fires (15.2%) took place on Friday, and the least (12.9%) on Wednesday.
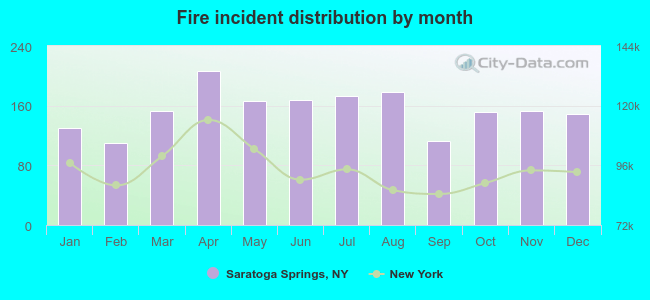 Based on the 1,850 incident reports from years 2002 - 2018 most fires (11.2%) took place during April, and the least (5.9%) in February.
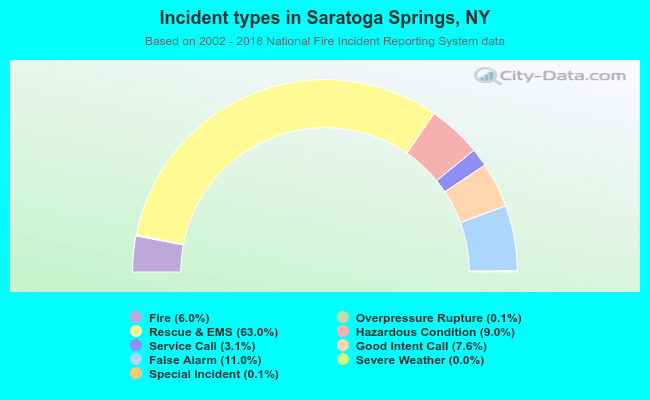 Out of all 30,620 cases reported during the years 2002 - 2018, the most belonged to the categories: Rescue & EMS (63.0%), False Alarm (11.0%), and Hazardous Condition (9.0%).
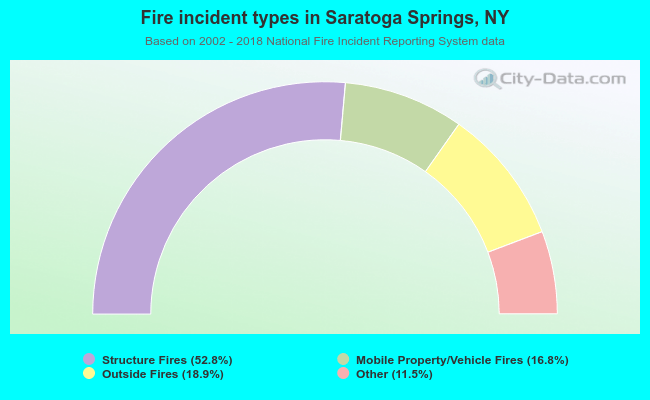 When looking into fire subcategories, the most incidents belonged to: Structure Fires (52.8%), and Outside Fires (18.9%).